On this page
📕 How to use GitHub Star History

When choosing a tool (especially an open-source one) to use, what's your thought process? What are the factors that matter to you?
- Any other users out there?
- Is it the most popular in this category?
- Is this technology in decline?
Here's one obvious metric I'm sure you will also investigate: its GitHub stars.
You can't fully trust a project's GitHub stars alone. It is, however, a good way to determine if a tool is an adequate one and if it's likely to grow, if you use it correctly.
Even if a project has hundreds of millions of stars now, doesn't mean that it's still gaining popularity or maintained. Or if the project had an explosive breakout in the past? There's no way of knowing these simply from gazing at the stars count. Here's when Star History comes in handy: it shows how the number of GitHub stars of a project is increasing over the years. And - it's free and open-source.
How to add a repo

To add a repo, type in the search bar and click View star history. Three input formats are supported:
- Full URL:
https://github.com/star-history/star-history - Short form:
star-history/star-history - Org-only (when repo name matches org name):
star-history
For something like hashicorp/terraform, you need to specify the full hashicorp/terraform since the org and repo names don't match.
You can also paste multiple repos at once, separated by commas.
How to compare multiple repos
After adding one repo, continue typing the next repo in the input box. They will all be rendered in the same chart.
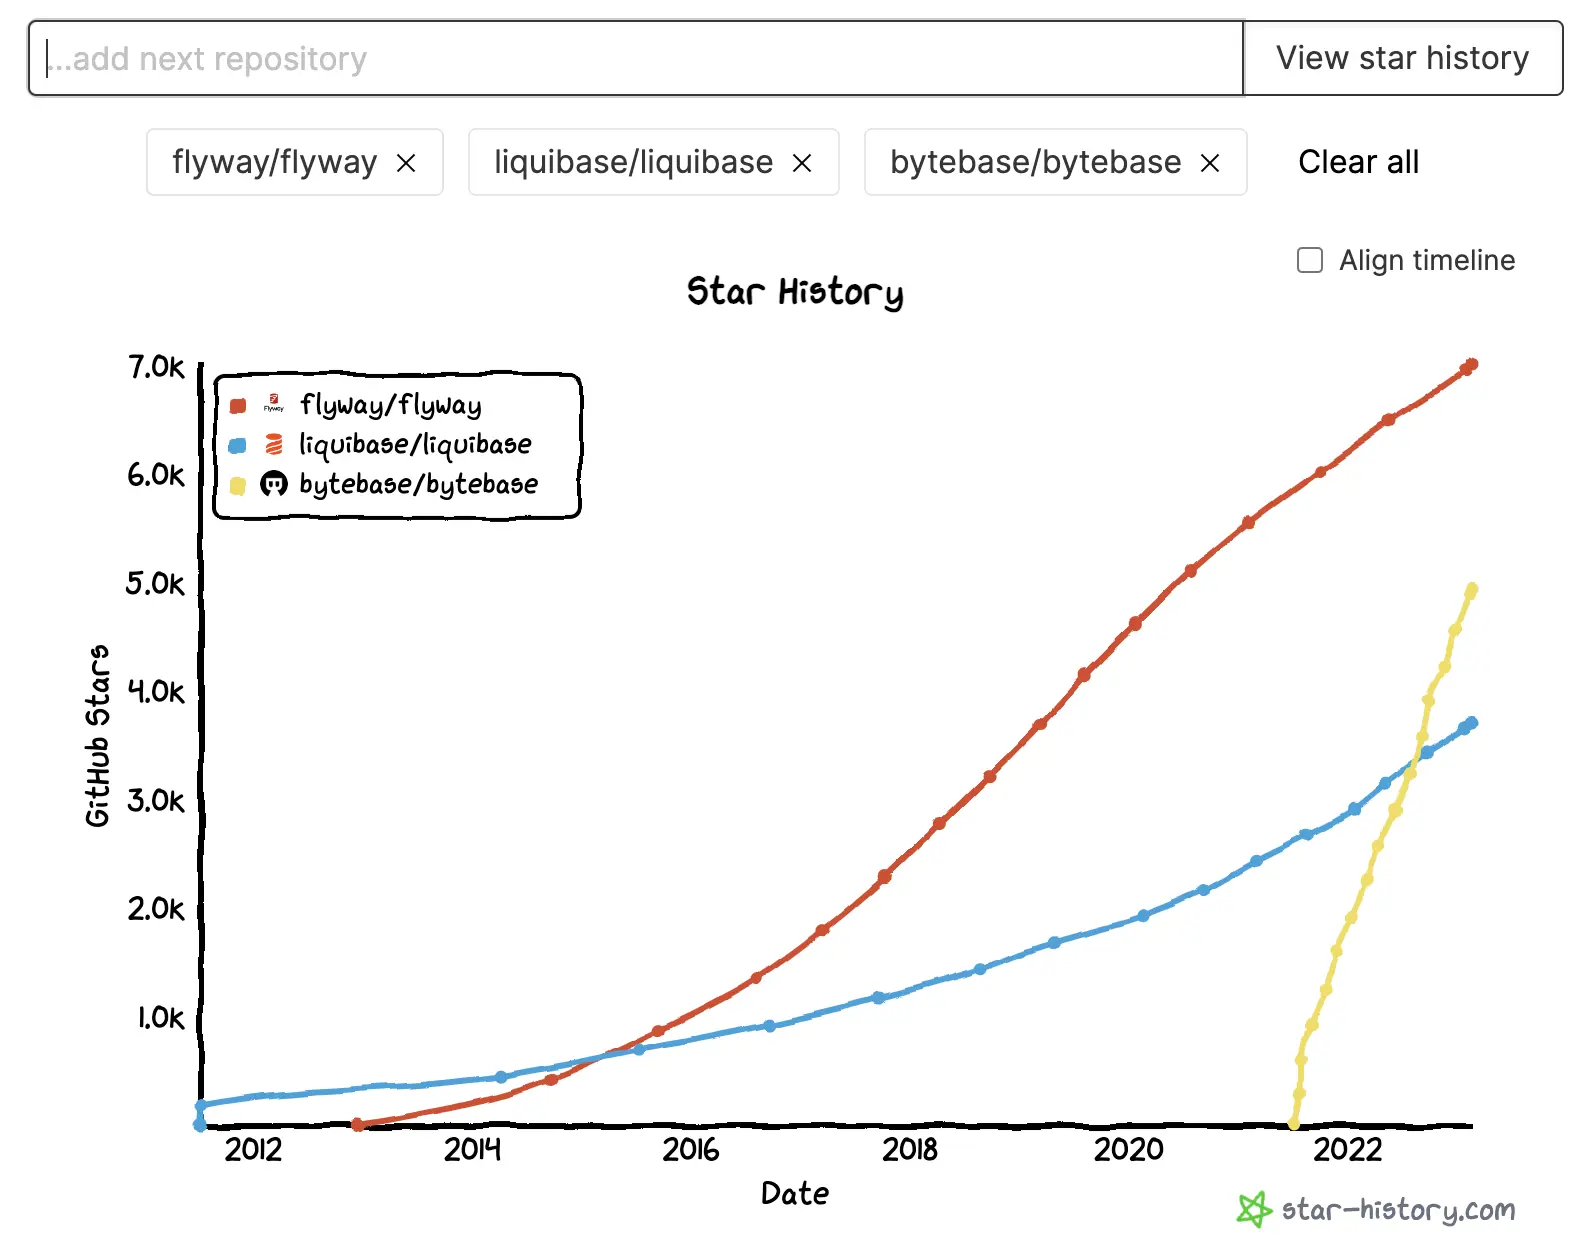
Each repo appears as a pill-shaped badge below the input. You can:
- Toggle visibility: Click a repo name to show/hide it in the chart (hidden repos appear with a strikethrough).
- Remove a repo: Click the X button on the badge.
- Clear all: Click "Clear all" to start fresh.
How to align the timeline
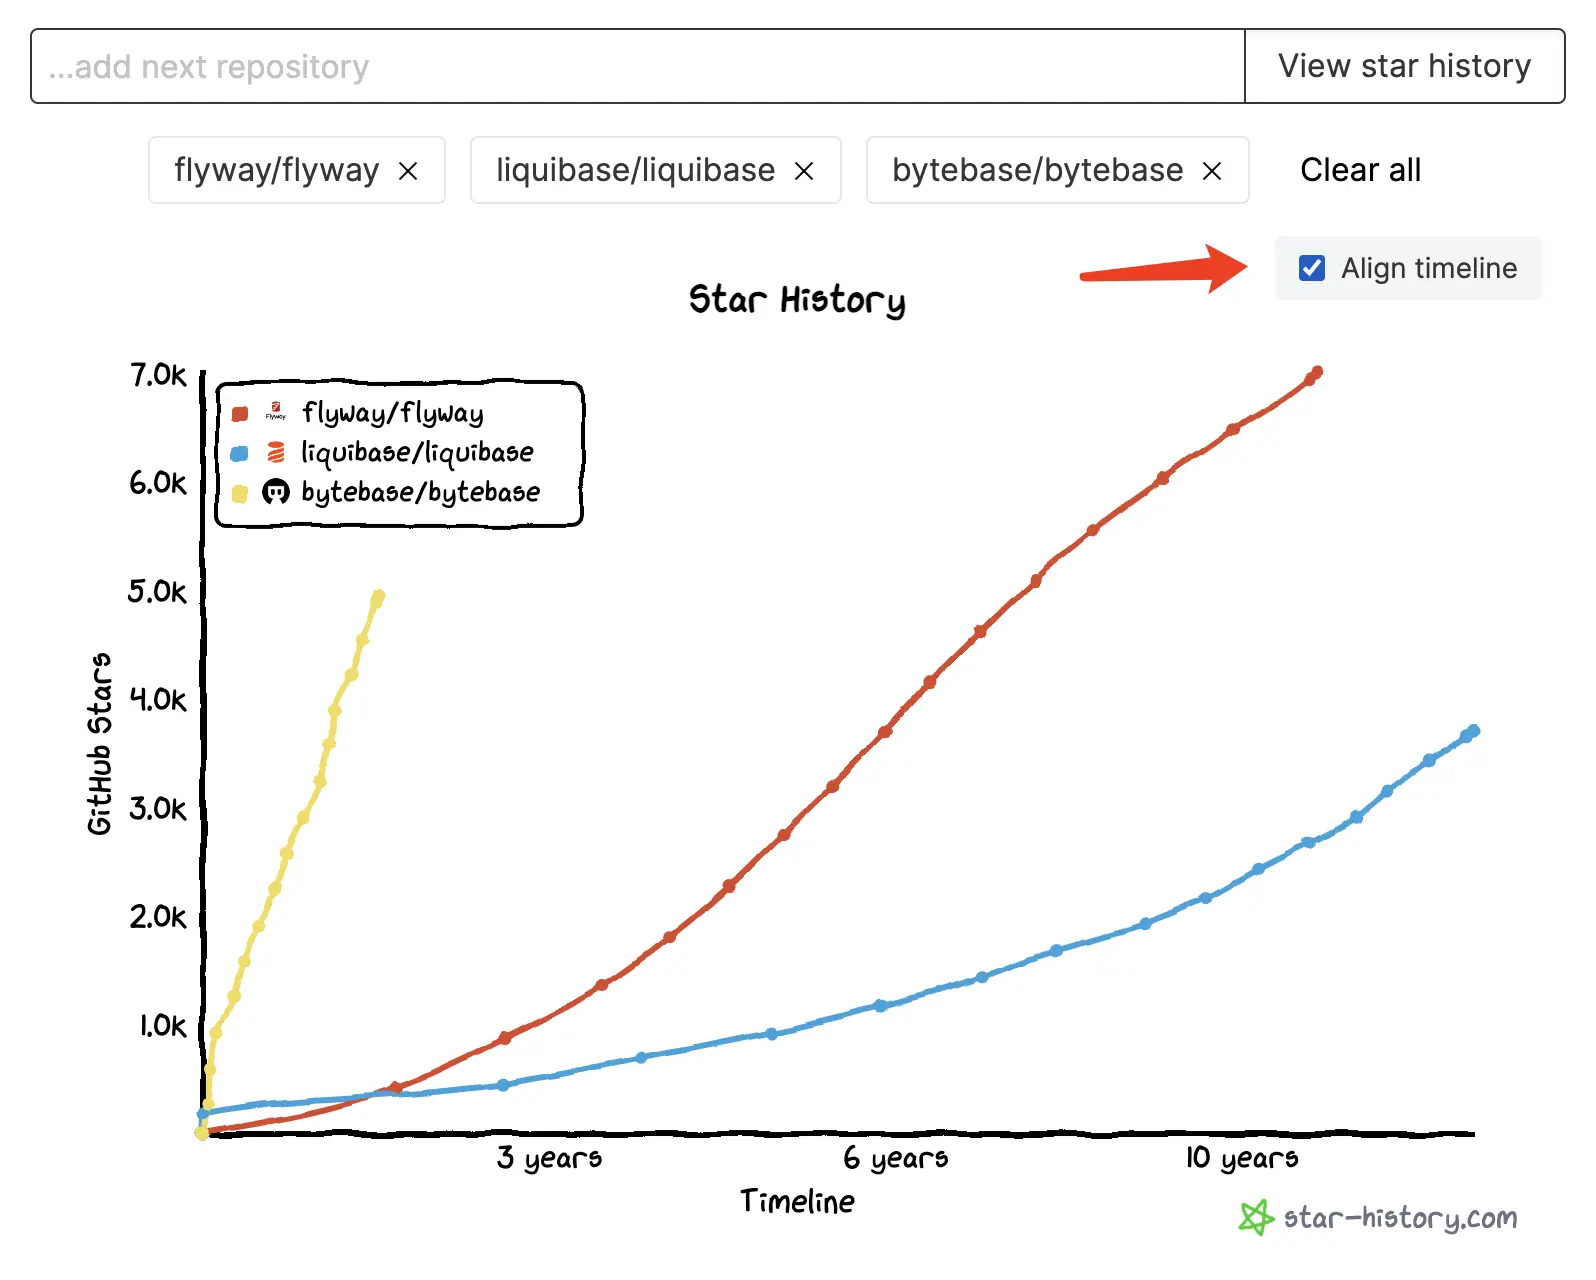
Check Align timeline above the chart to switch from calendar time (Date mode) to days-since-first-star (Timeline mode). This lets you compare the growth trajectories of repos that started at different times.
Log scale
Check Log scale to switch the Y-axis to logarithmic scale. This is useful when comparing repos with vastly different star counts — it makes it easier to see growth patterns across different magnitudes.
Legend position
Use the Legend radio buttons to place the legend at Top left (default) or Bottom right, depending on where the chart lines are.
How to export
Below the chart, you'll find these action buttons:
- Image: Download the chart as a PNG image.
- CSV: Export the raw star history data as a CSV file.
- Link: Copy the current URL (with all chart state encoded in query params) to share with others.
- Share: Share the chart on X (Twitter).
How to add your GitHub access token
Star History reads star data from GitHub's star history API, which only answers authenticated requests. Any GitHub access token works, for any public repository, and a token also raises your API rate limit. The token needs no permissions or scopes at all.
Your token is stored only in your browser's local storage — it is never sent to Star History servers.
Choose one:
Fine-grained token.
- Create a fine-grained token.
- Leave Repository access on the default Public repositories.
- Under Permissions, add nothing.
Classic token.
- Create a classic token.
- Under Select scopes, tick nothing.
Then, on star-history.com, click Add access token in the header, paste your token, and hit Save.
How to embed the chart in your README
The Show real-time chart on your README.md section below the chart generates a live chart image for your README.
- Pick a format. GitHub README.md is a
<picture>element that follows the viewer's light or dark theme. Plain Markdown is a single image link for any Markdown renderer. - Click Copy to GitHub README.md, or Copy on the Plain Markdown tab. After copying, the GitHub button turns into a shortcut that opens your README on GitHub for editing.
- Paste the snippet into your README.
The embed keeps your current chart settings — repos, Date/Timeline mode, log scale, legend position — and re-renders with the latest stars each time it is viewed.
Chrome extension
We also have a Chrome extension. Install it, then go to any GitHub repo and click the extension icon — a star history chart will pop up right there.
Play around and let us know @StarHistoryHQ what you think!