
Star History Monthly December 2024 | AI Data Visualization
AI data visualization tools are insightful integrations of AI and traditional data analytics tools that help you better understand your data in a more intuitive way. Here are some promising open-source tools that can help streamline your AI data visualization workflow.
PandasAI
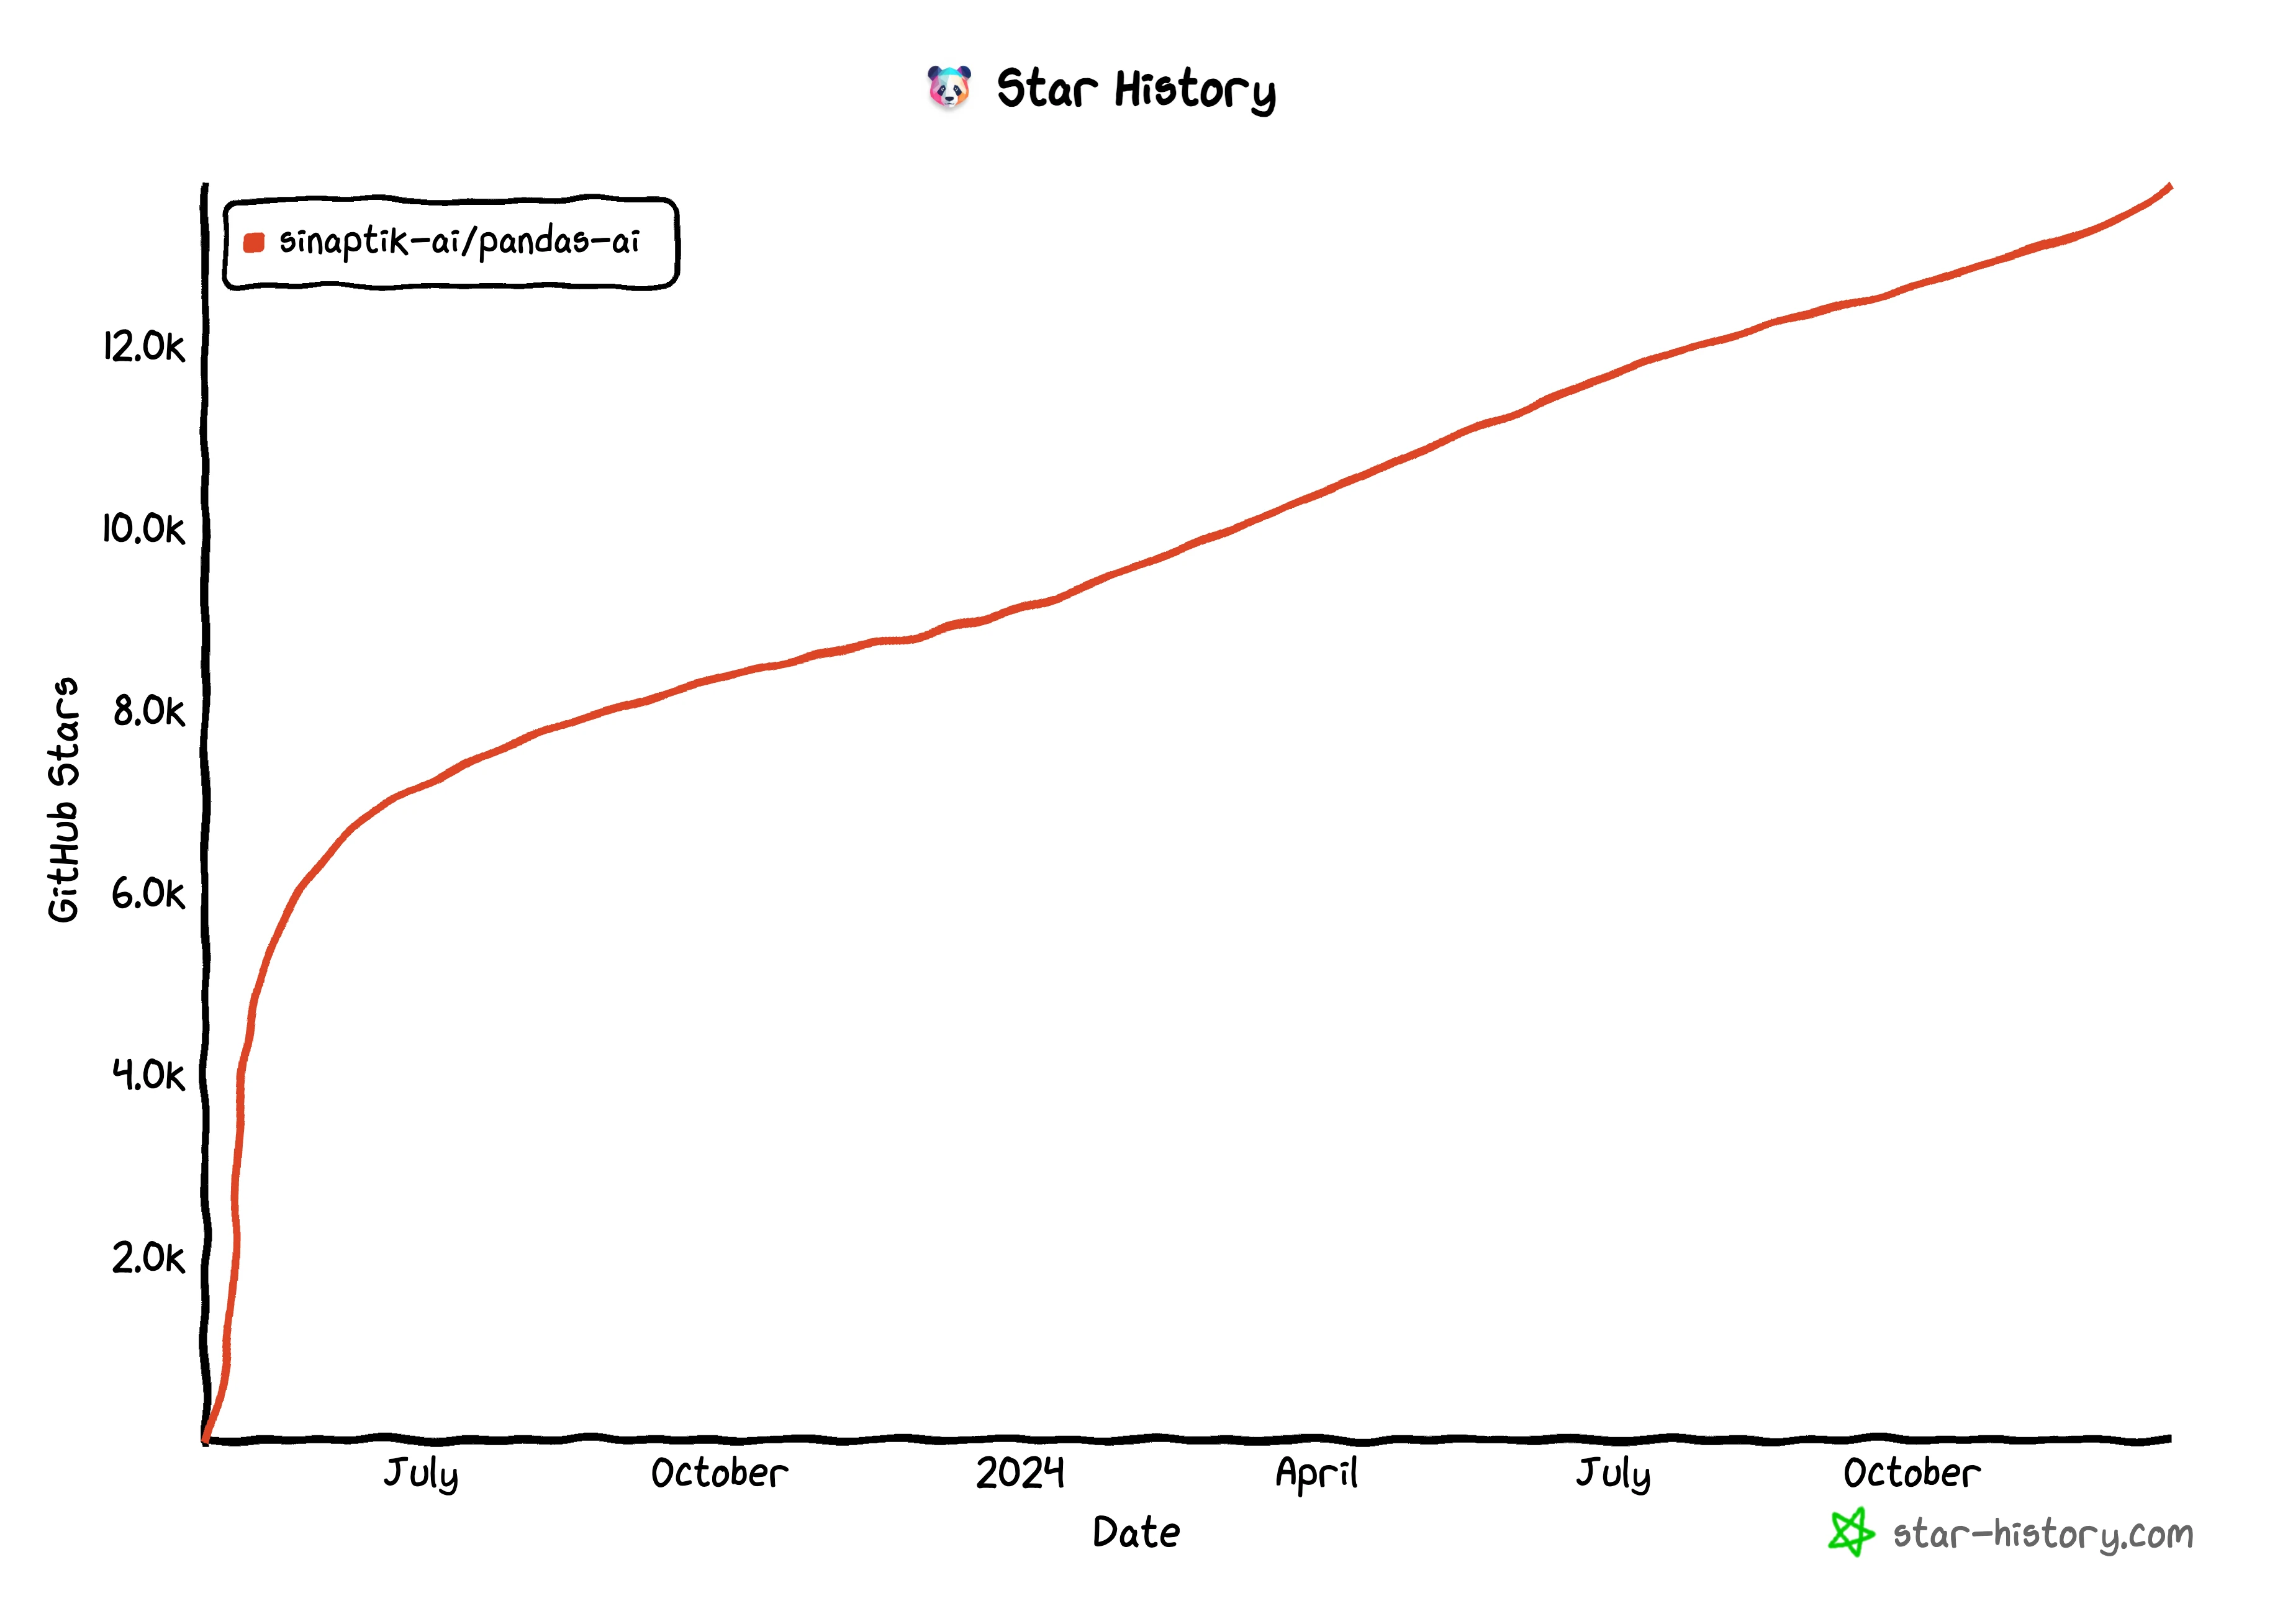
PandasAI is a Python platform that makes it easy to ask questions to your data in natural language. It helps non-technical users to interact with their data in a more natural way, and it helps technical users to save time, and effort when working with data.
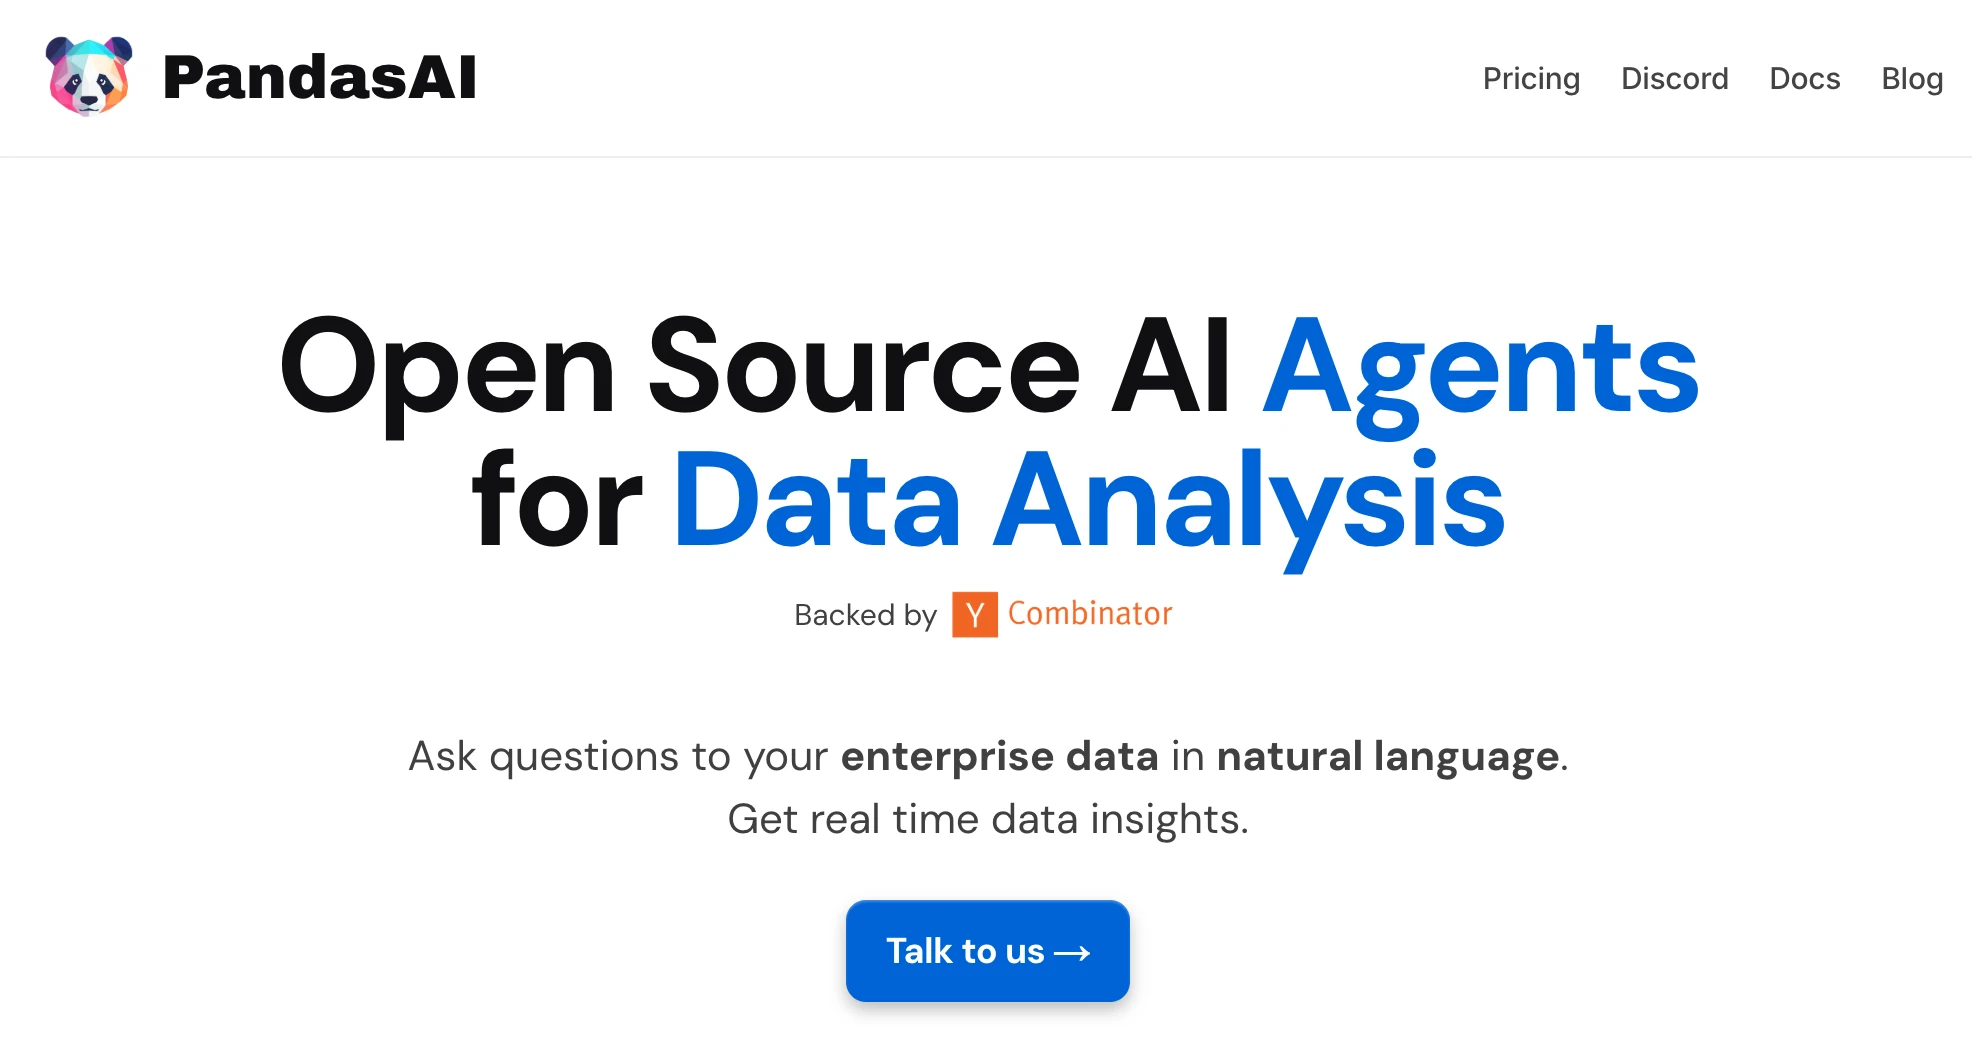
PandasAI supports multiple LLM providers including OpenAI, Anthropic, and local models. You can easily use it in your Jupyter notebooks or Streamlit apps, or you can deploy it as a REST API such as with FastAPI or Flask. Its modular architecture makes it easy to extend and customize for different use cases.
Grafana
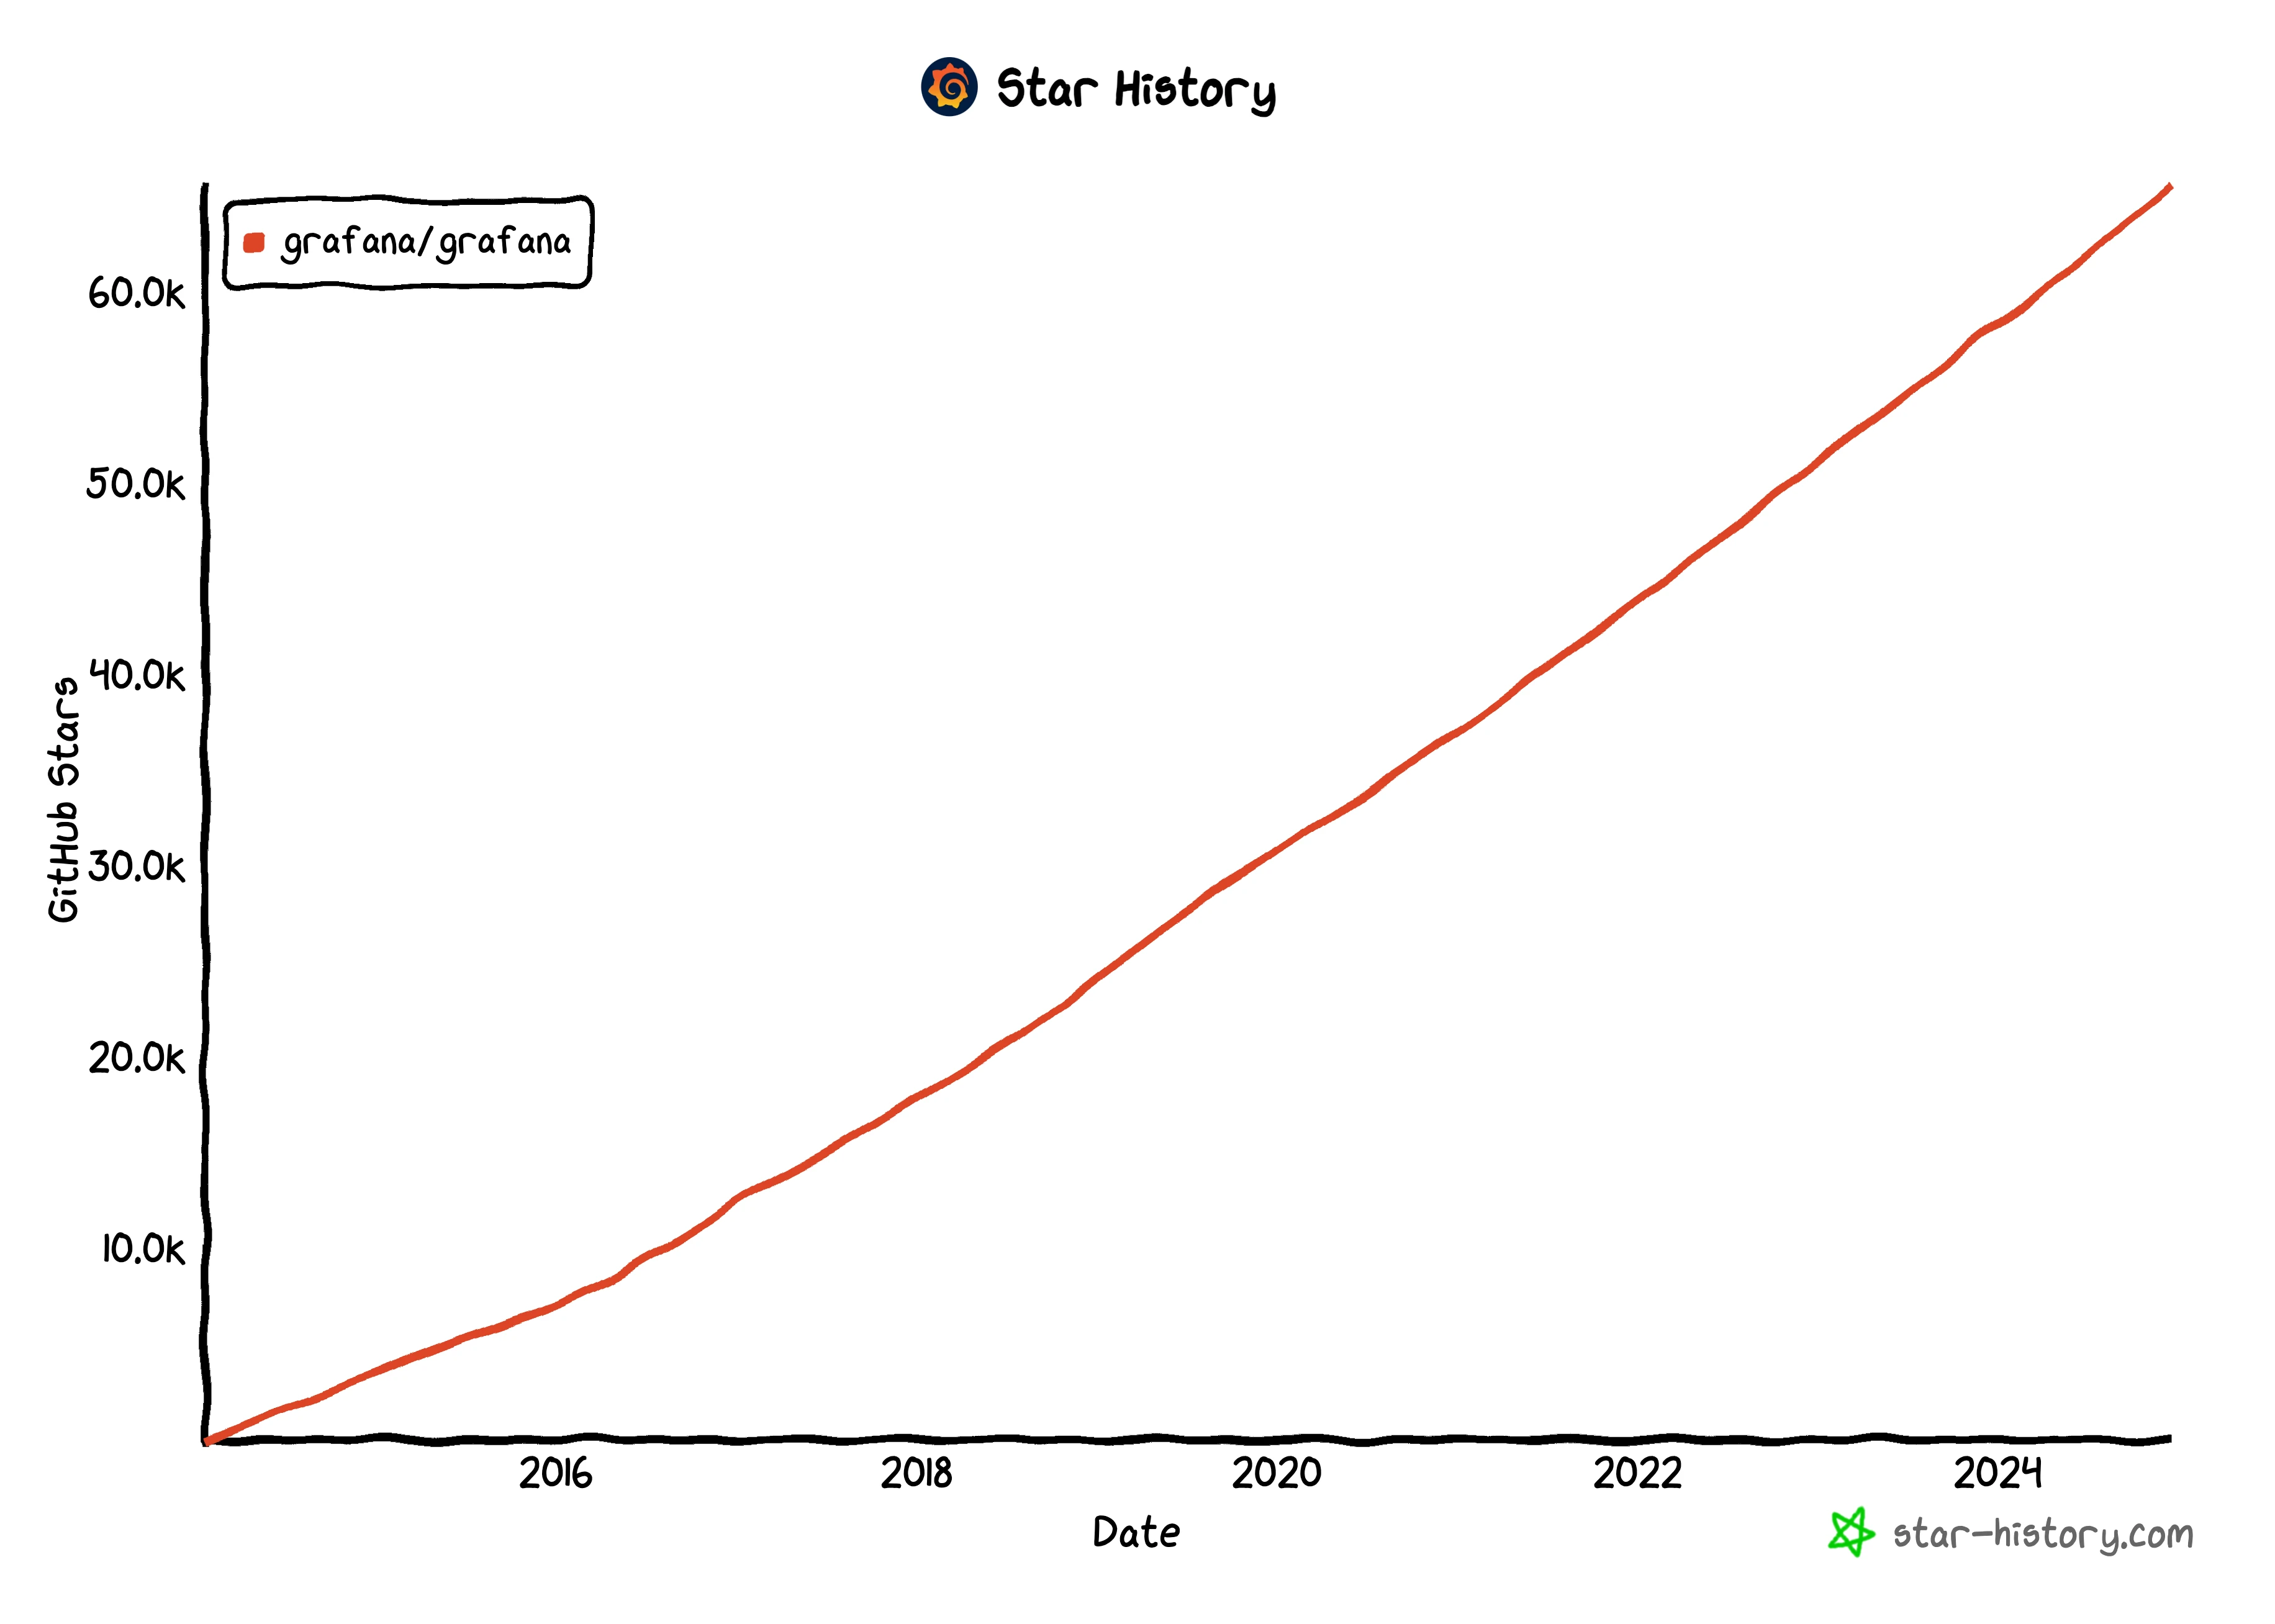
Grafana allows you to query, visualize, alert on and understand your metrics, as well as to create, explore, and share dashboards with your team and foster a data-driven culture. It features Visualizations, Dynamic Dashboards, Explore Metrics, Explore Logs, Alerting, Mixed Data Sources and more.
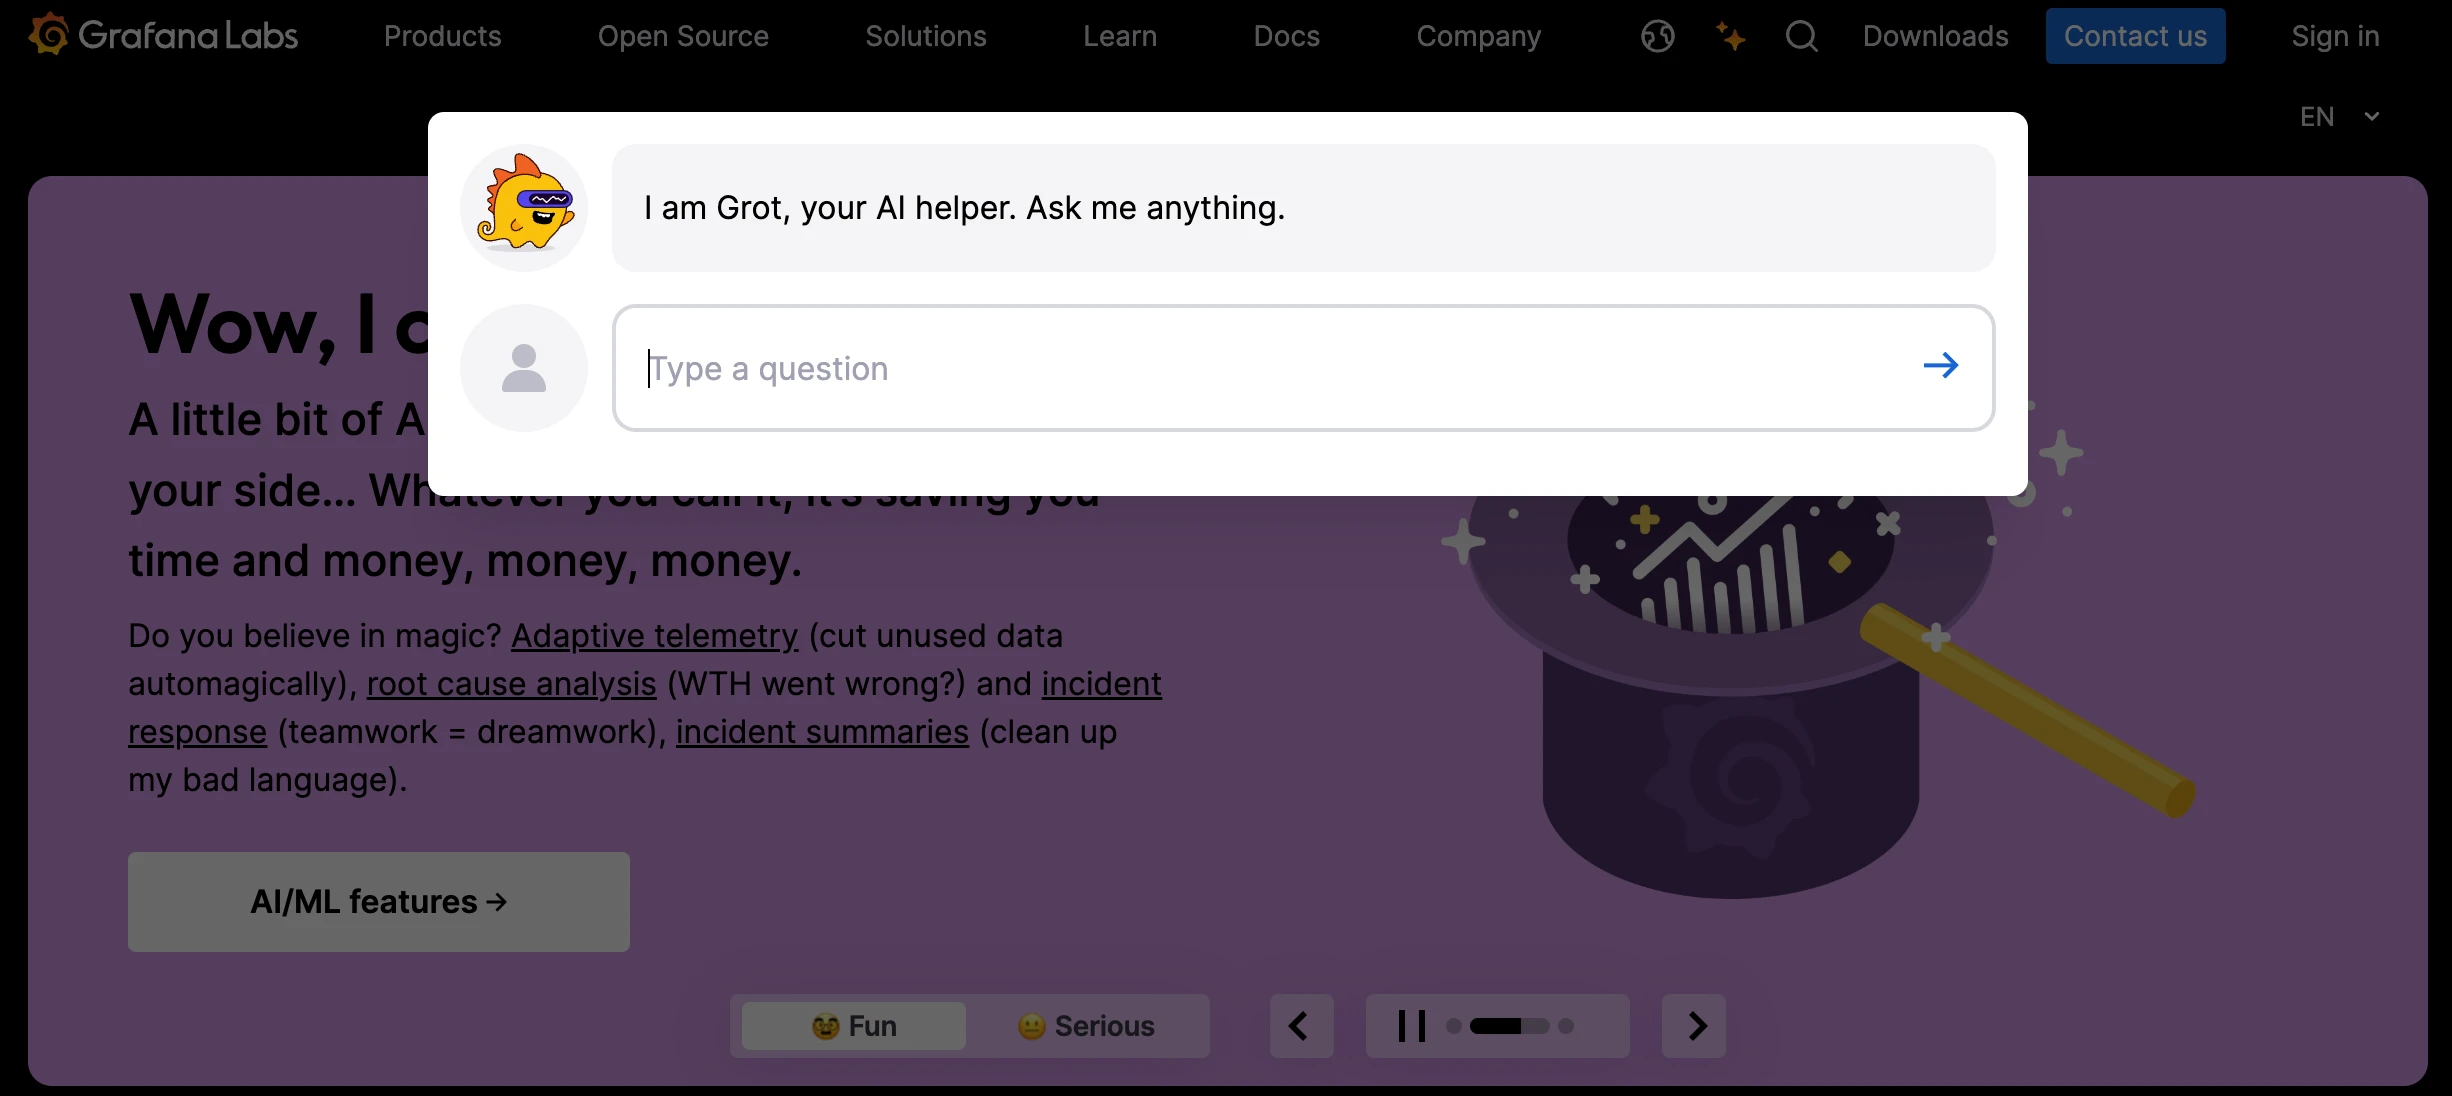
With Grot, the AI-powered Grafana chatbot, you can ask questions to your data in natural language and get answers in seconds.
Snowplow
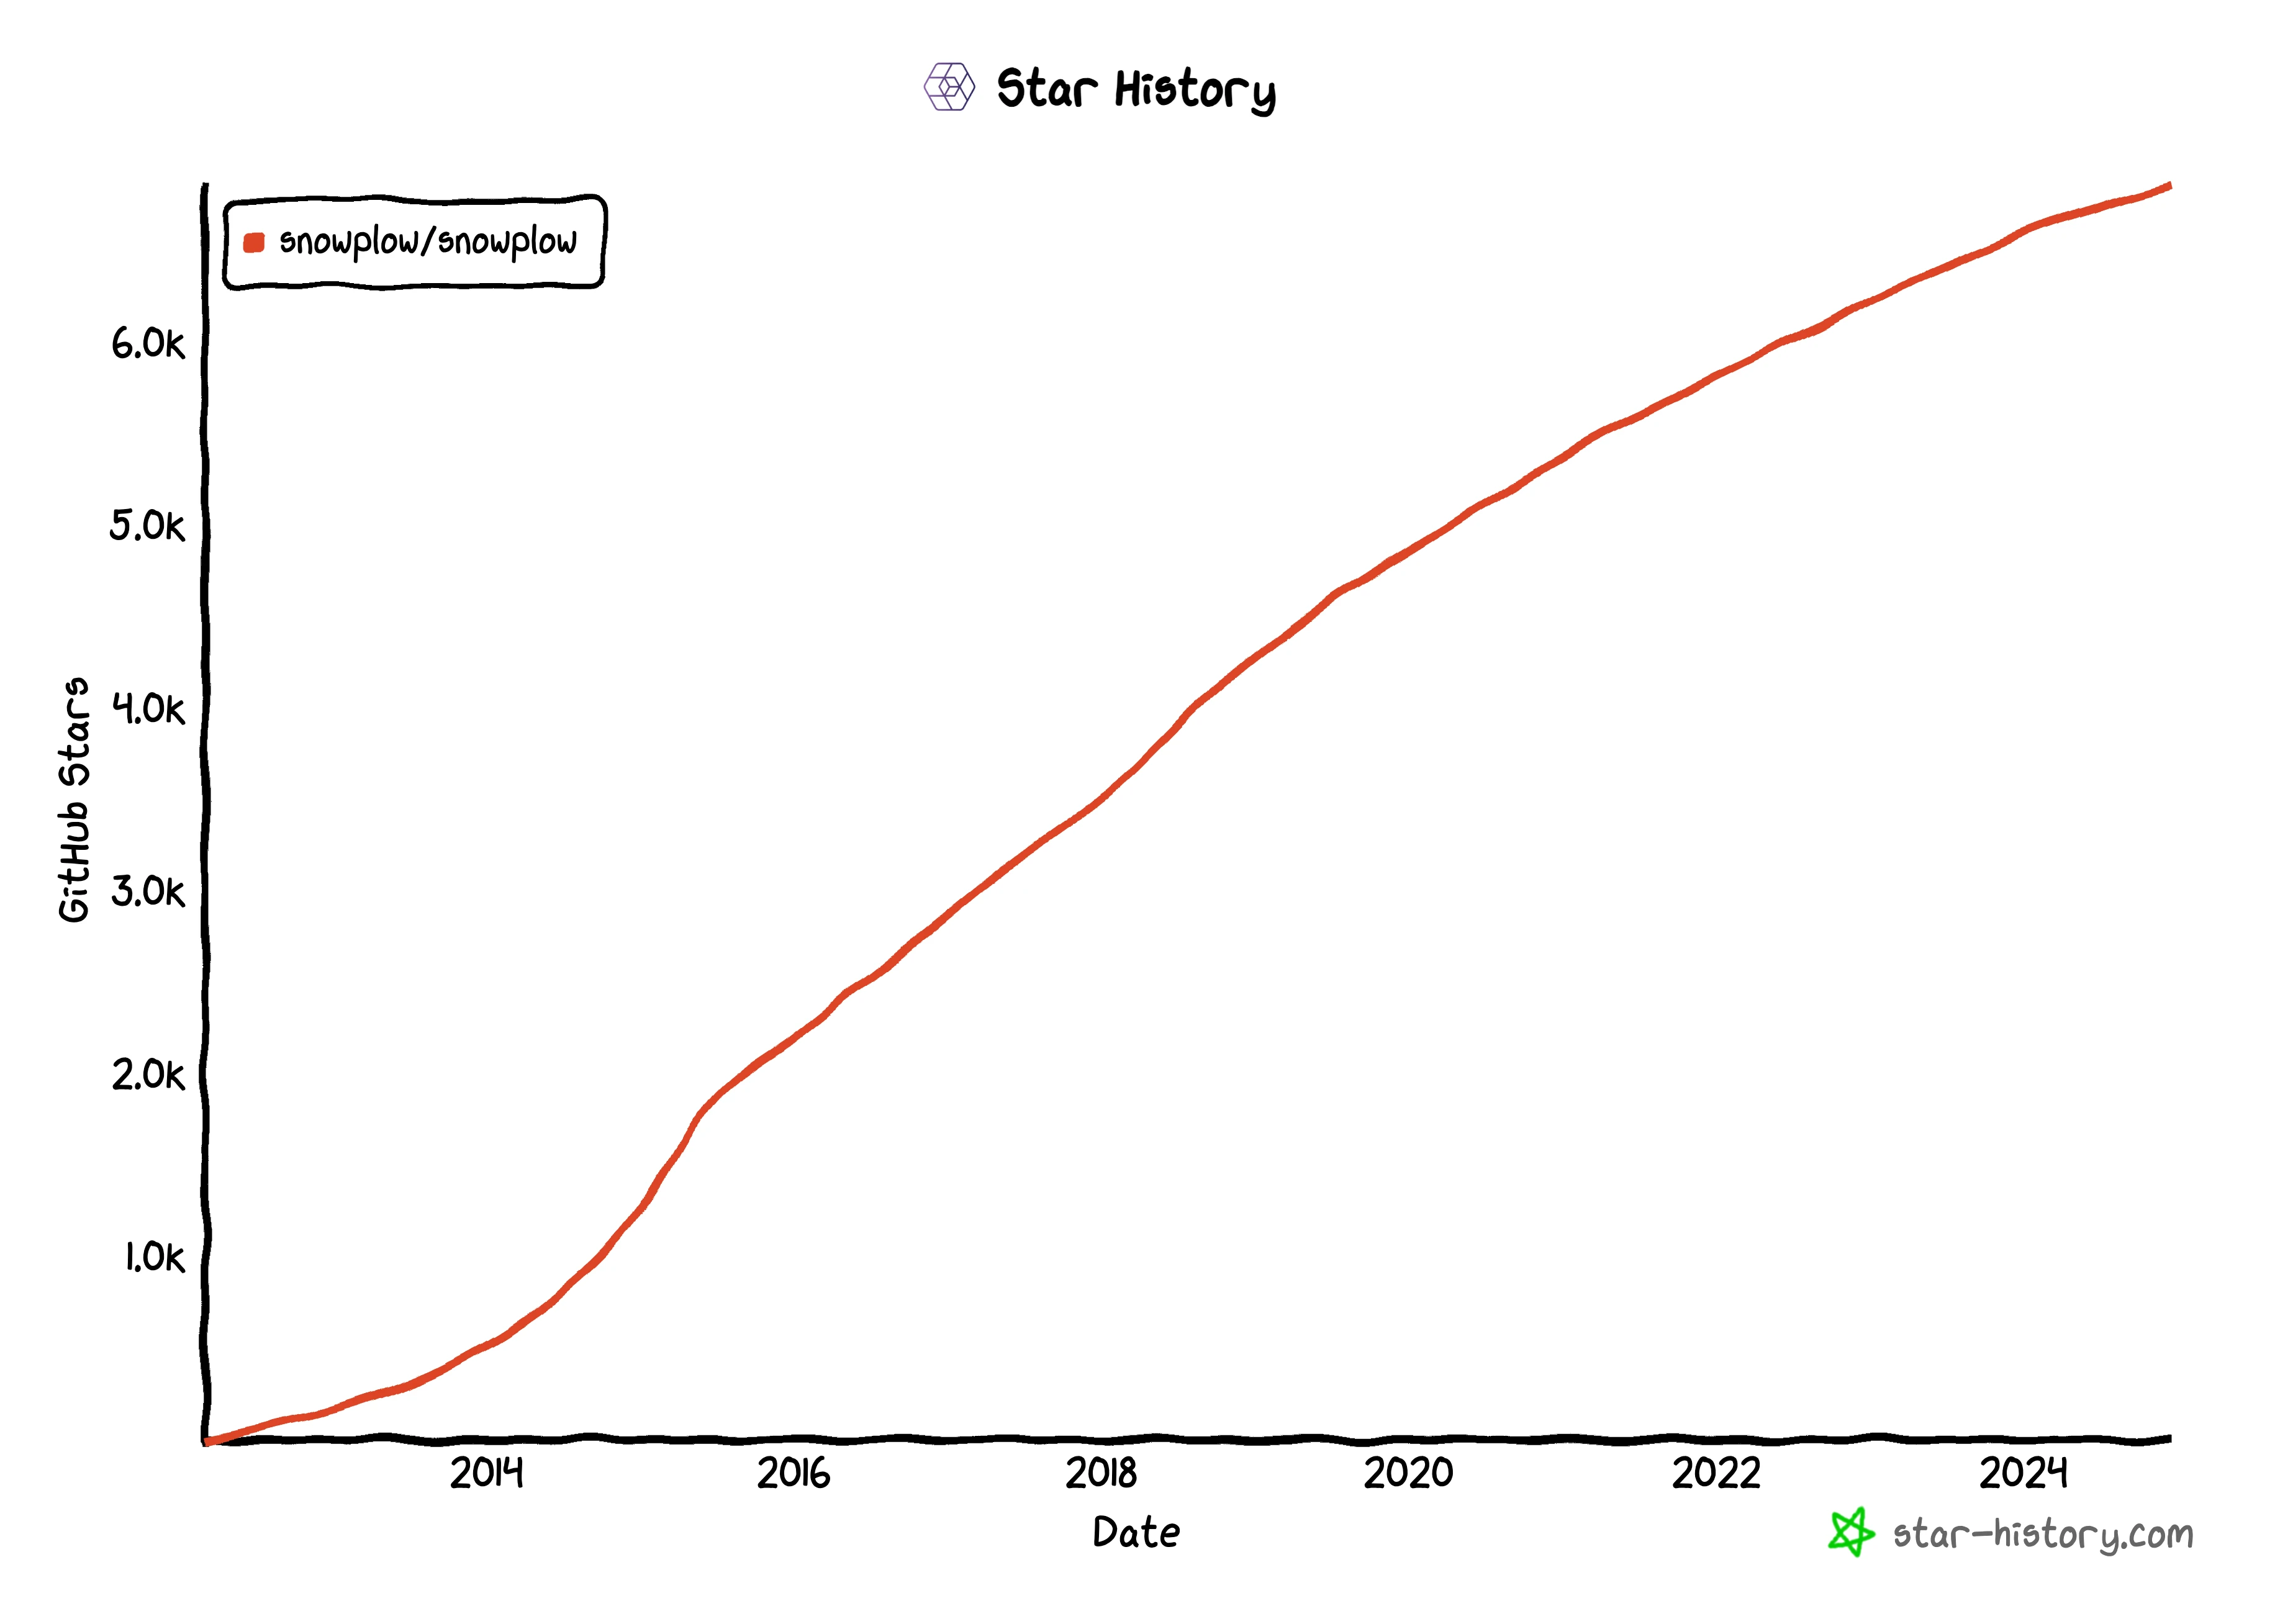
snowplow is an engine for collecting behavioral data that allows you to:
- Collect events such as impressions, clicks, video playback (or even custom events of your choosing).
- Store the data in a scalable data warehouse you control (like Databricks, Snowflake, etc.) or emit it via a stream.
- Leverage a wide range of tools to model and analyze the behavioral data: Metabase, Superset, and much more.
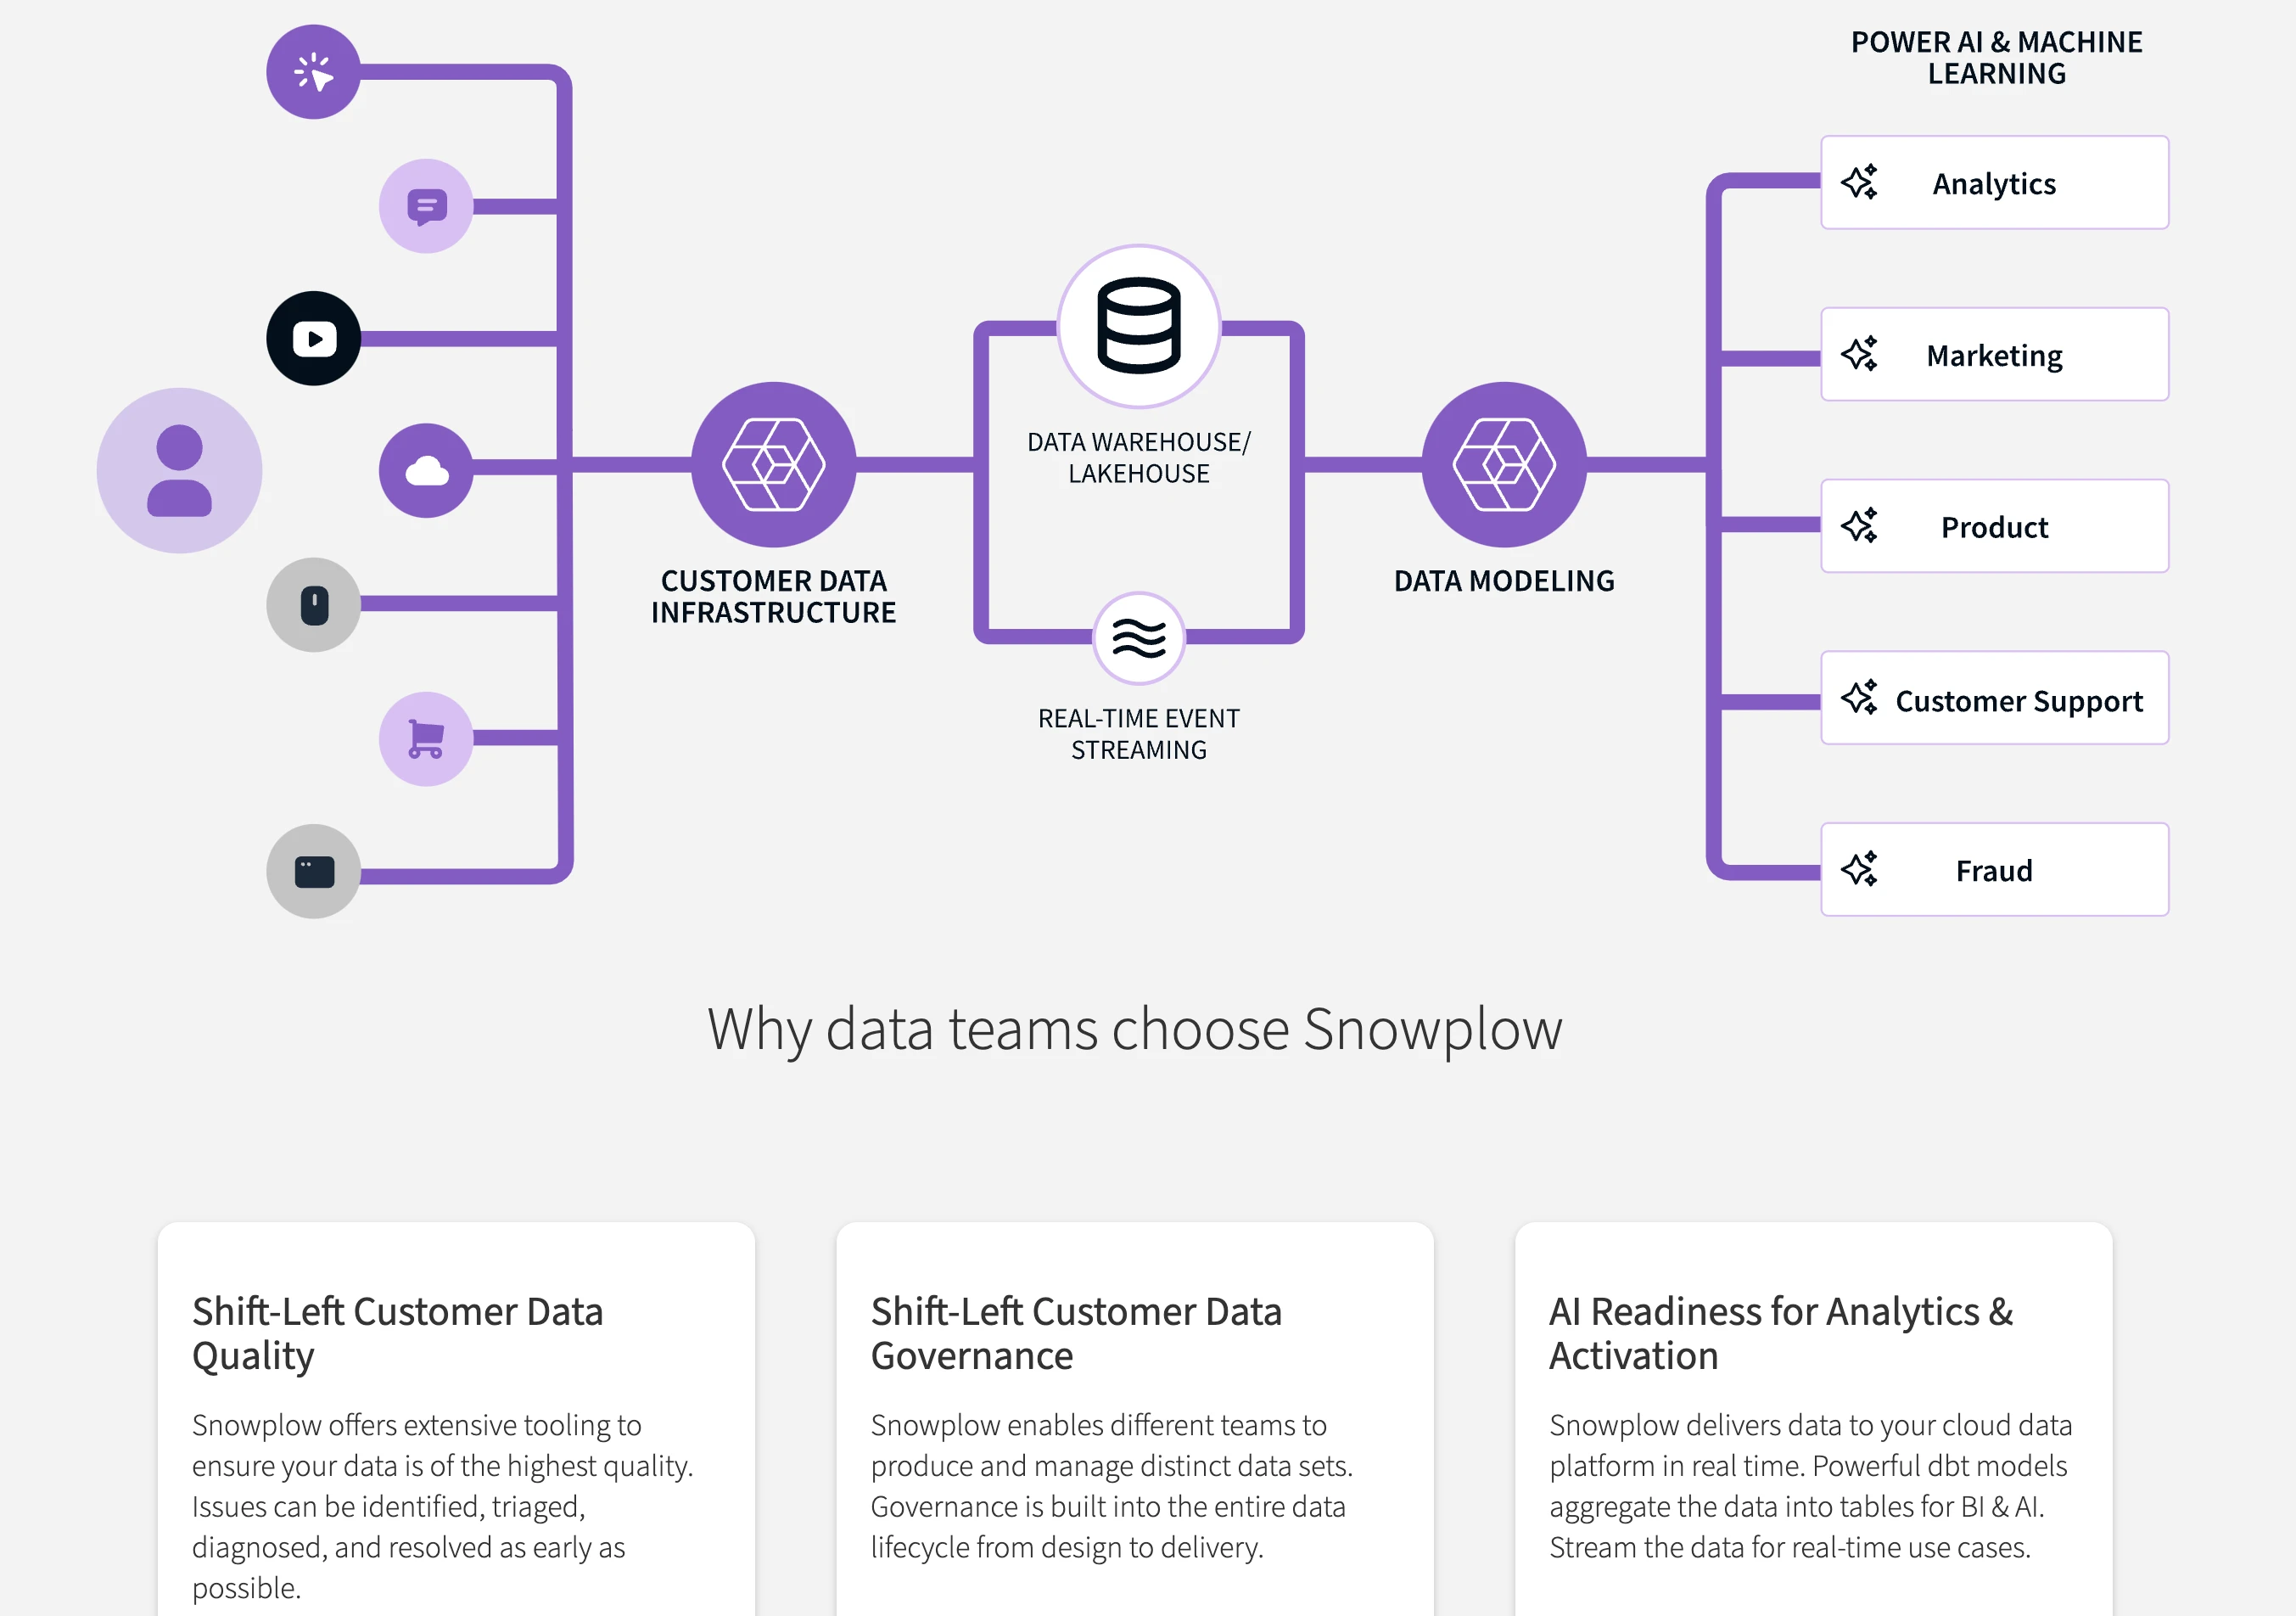
Snowplow enables businesses to make faster, better decisions by providing AI-ready data for training models, eliminating data wrangling, and ensuring data accuracy.
KNIME
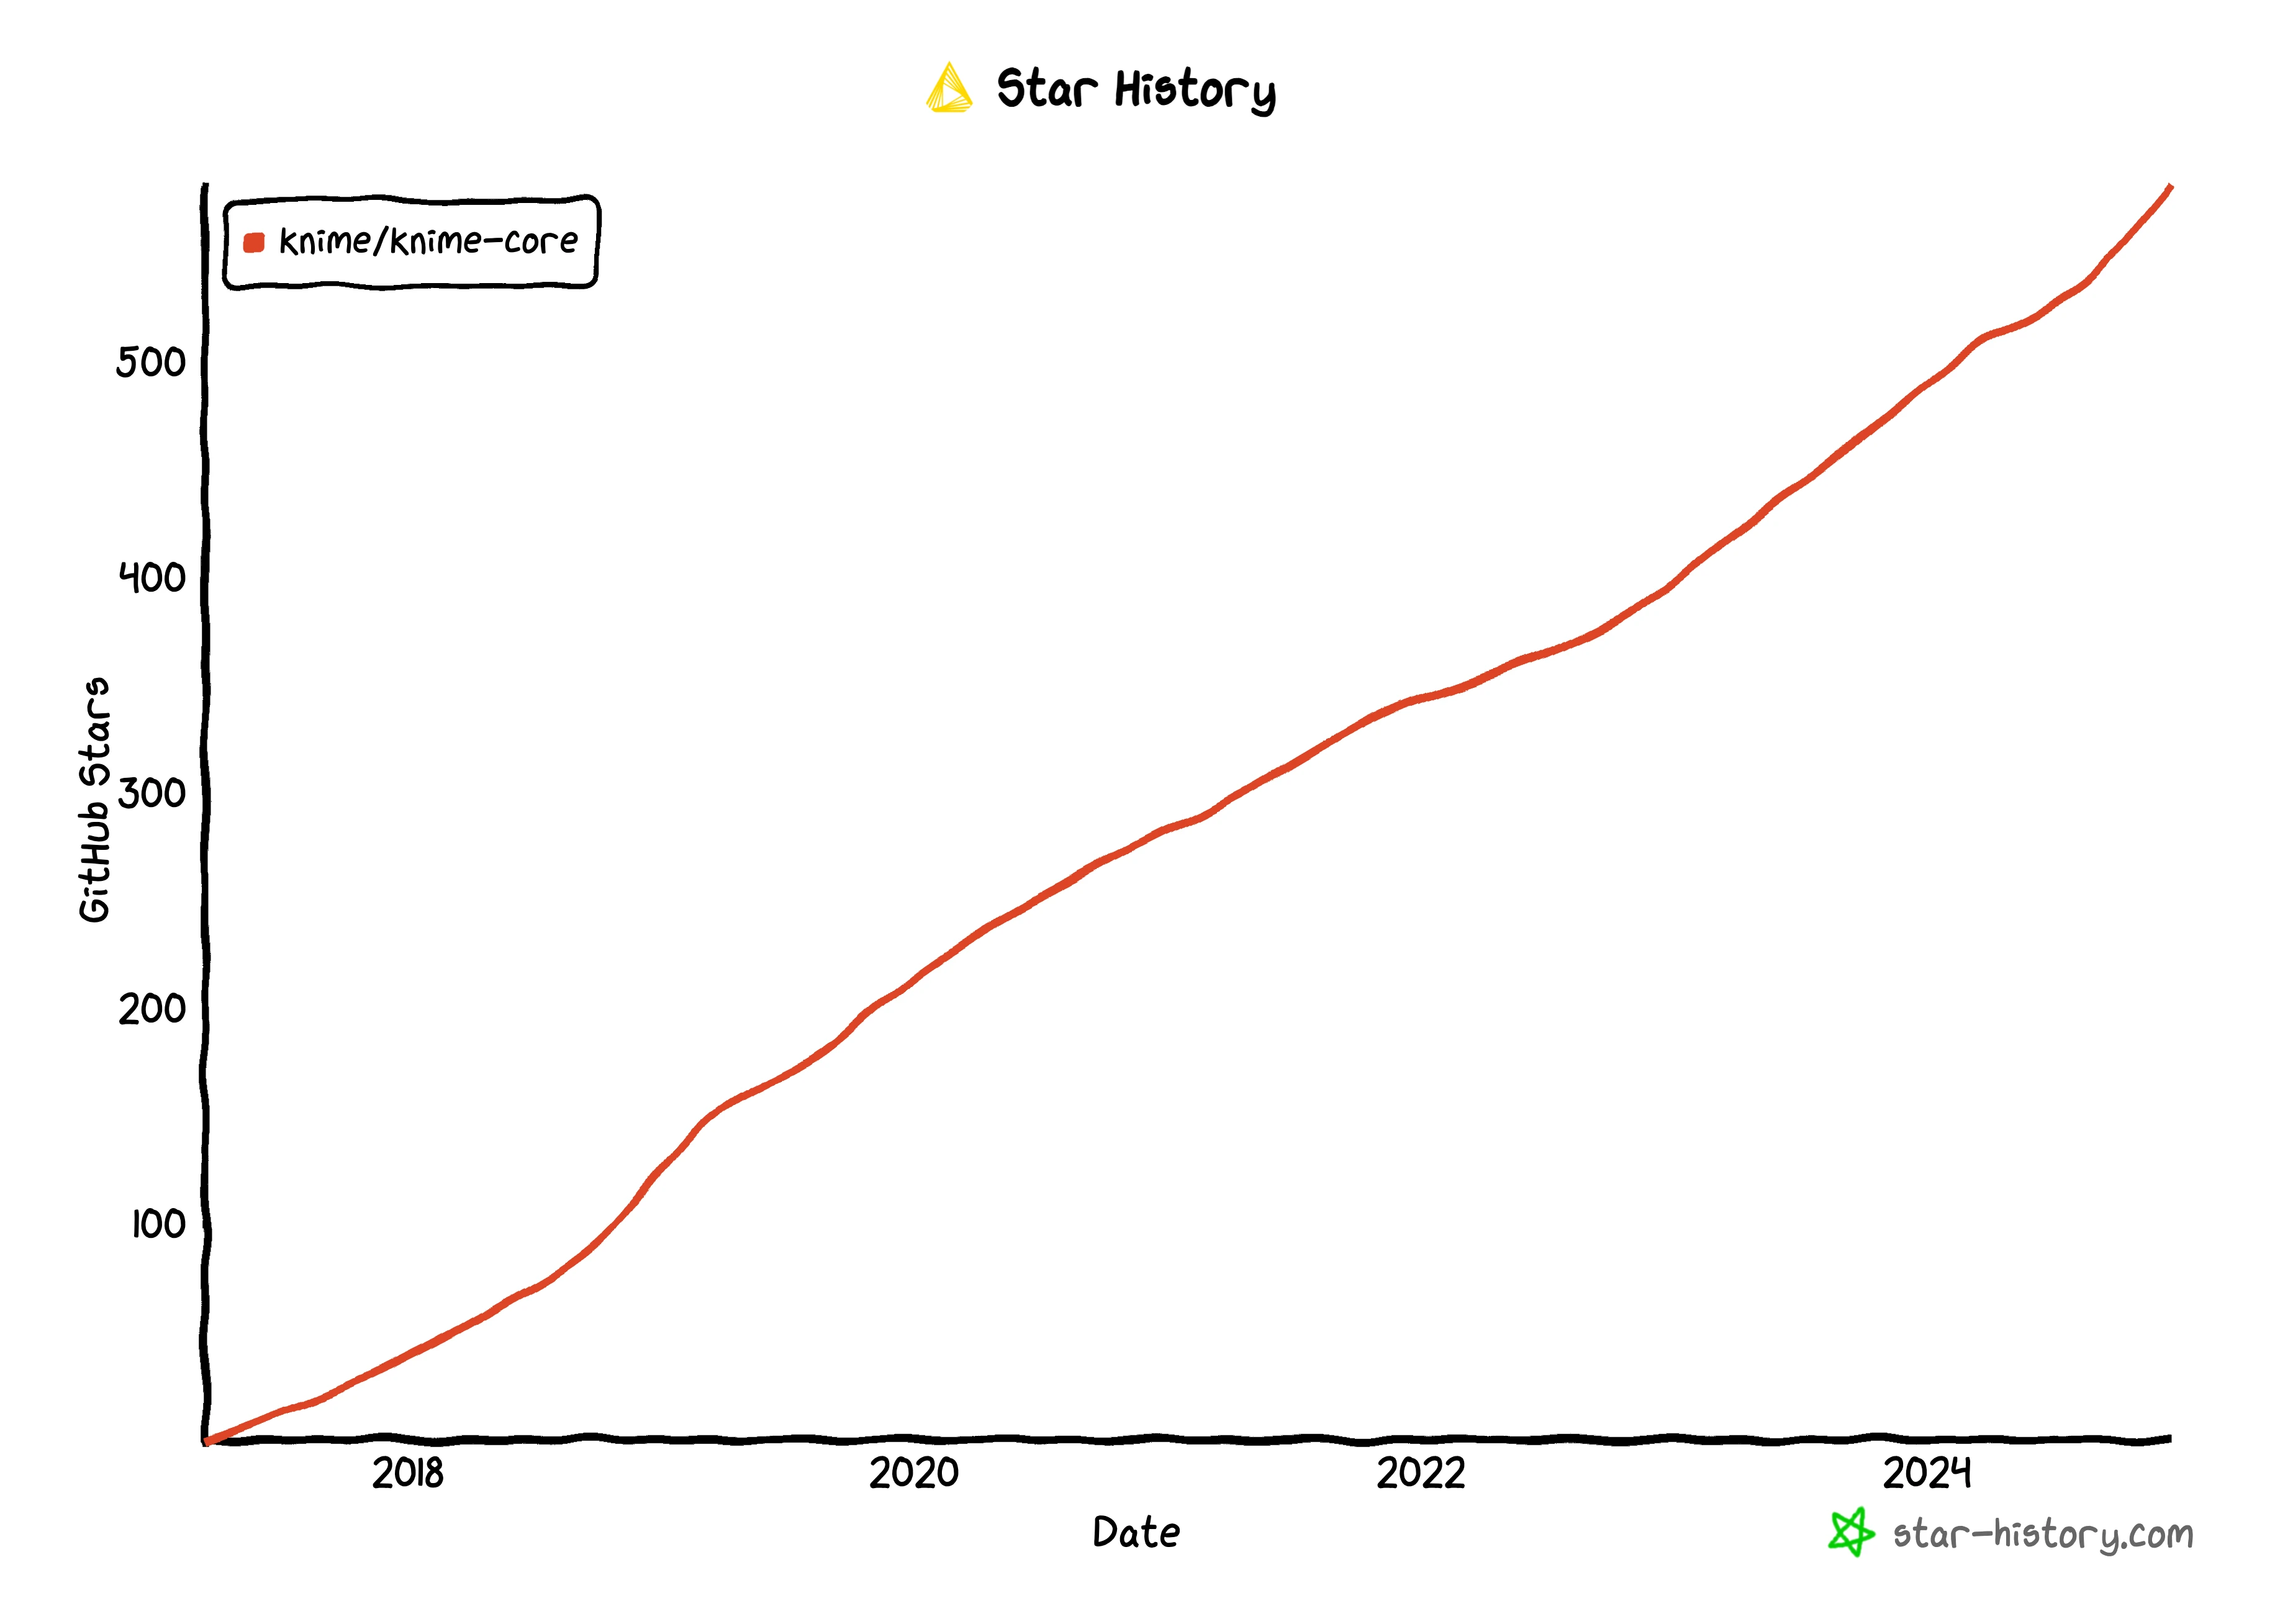
KNIME is an open-source data analytics platform that provides a comprehensive set of tools for data analysis, visualization, and modeling. It offers a flexible and scalable environment for building data pipelines and performing complex data operations.
KNIME focuses on developer experience with features like:
- Easy-to-use API
- Built-in conversation management
- Flexible message handling
- Support for multiple LLM providers
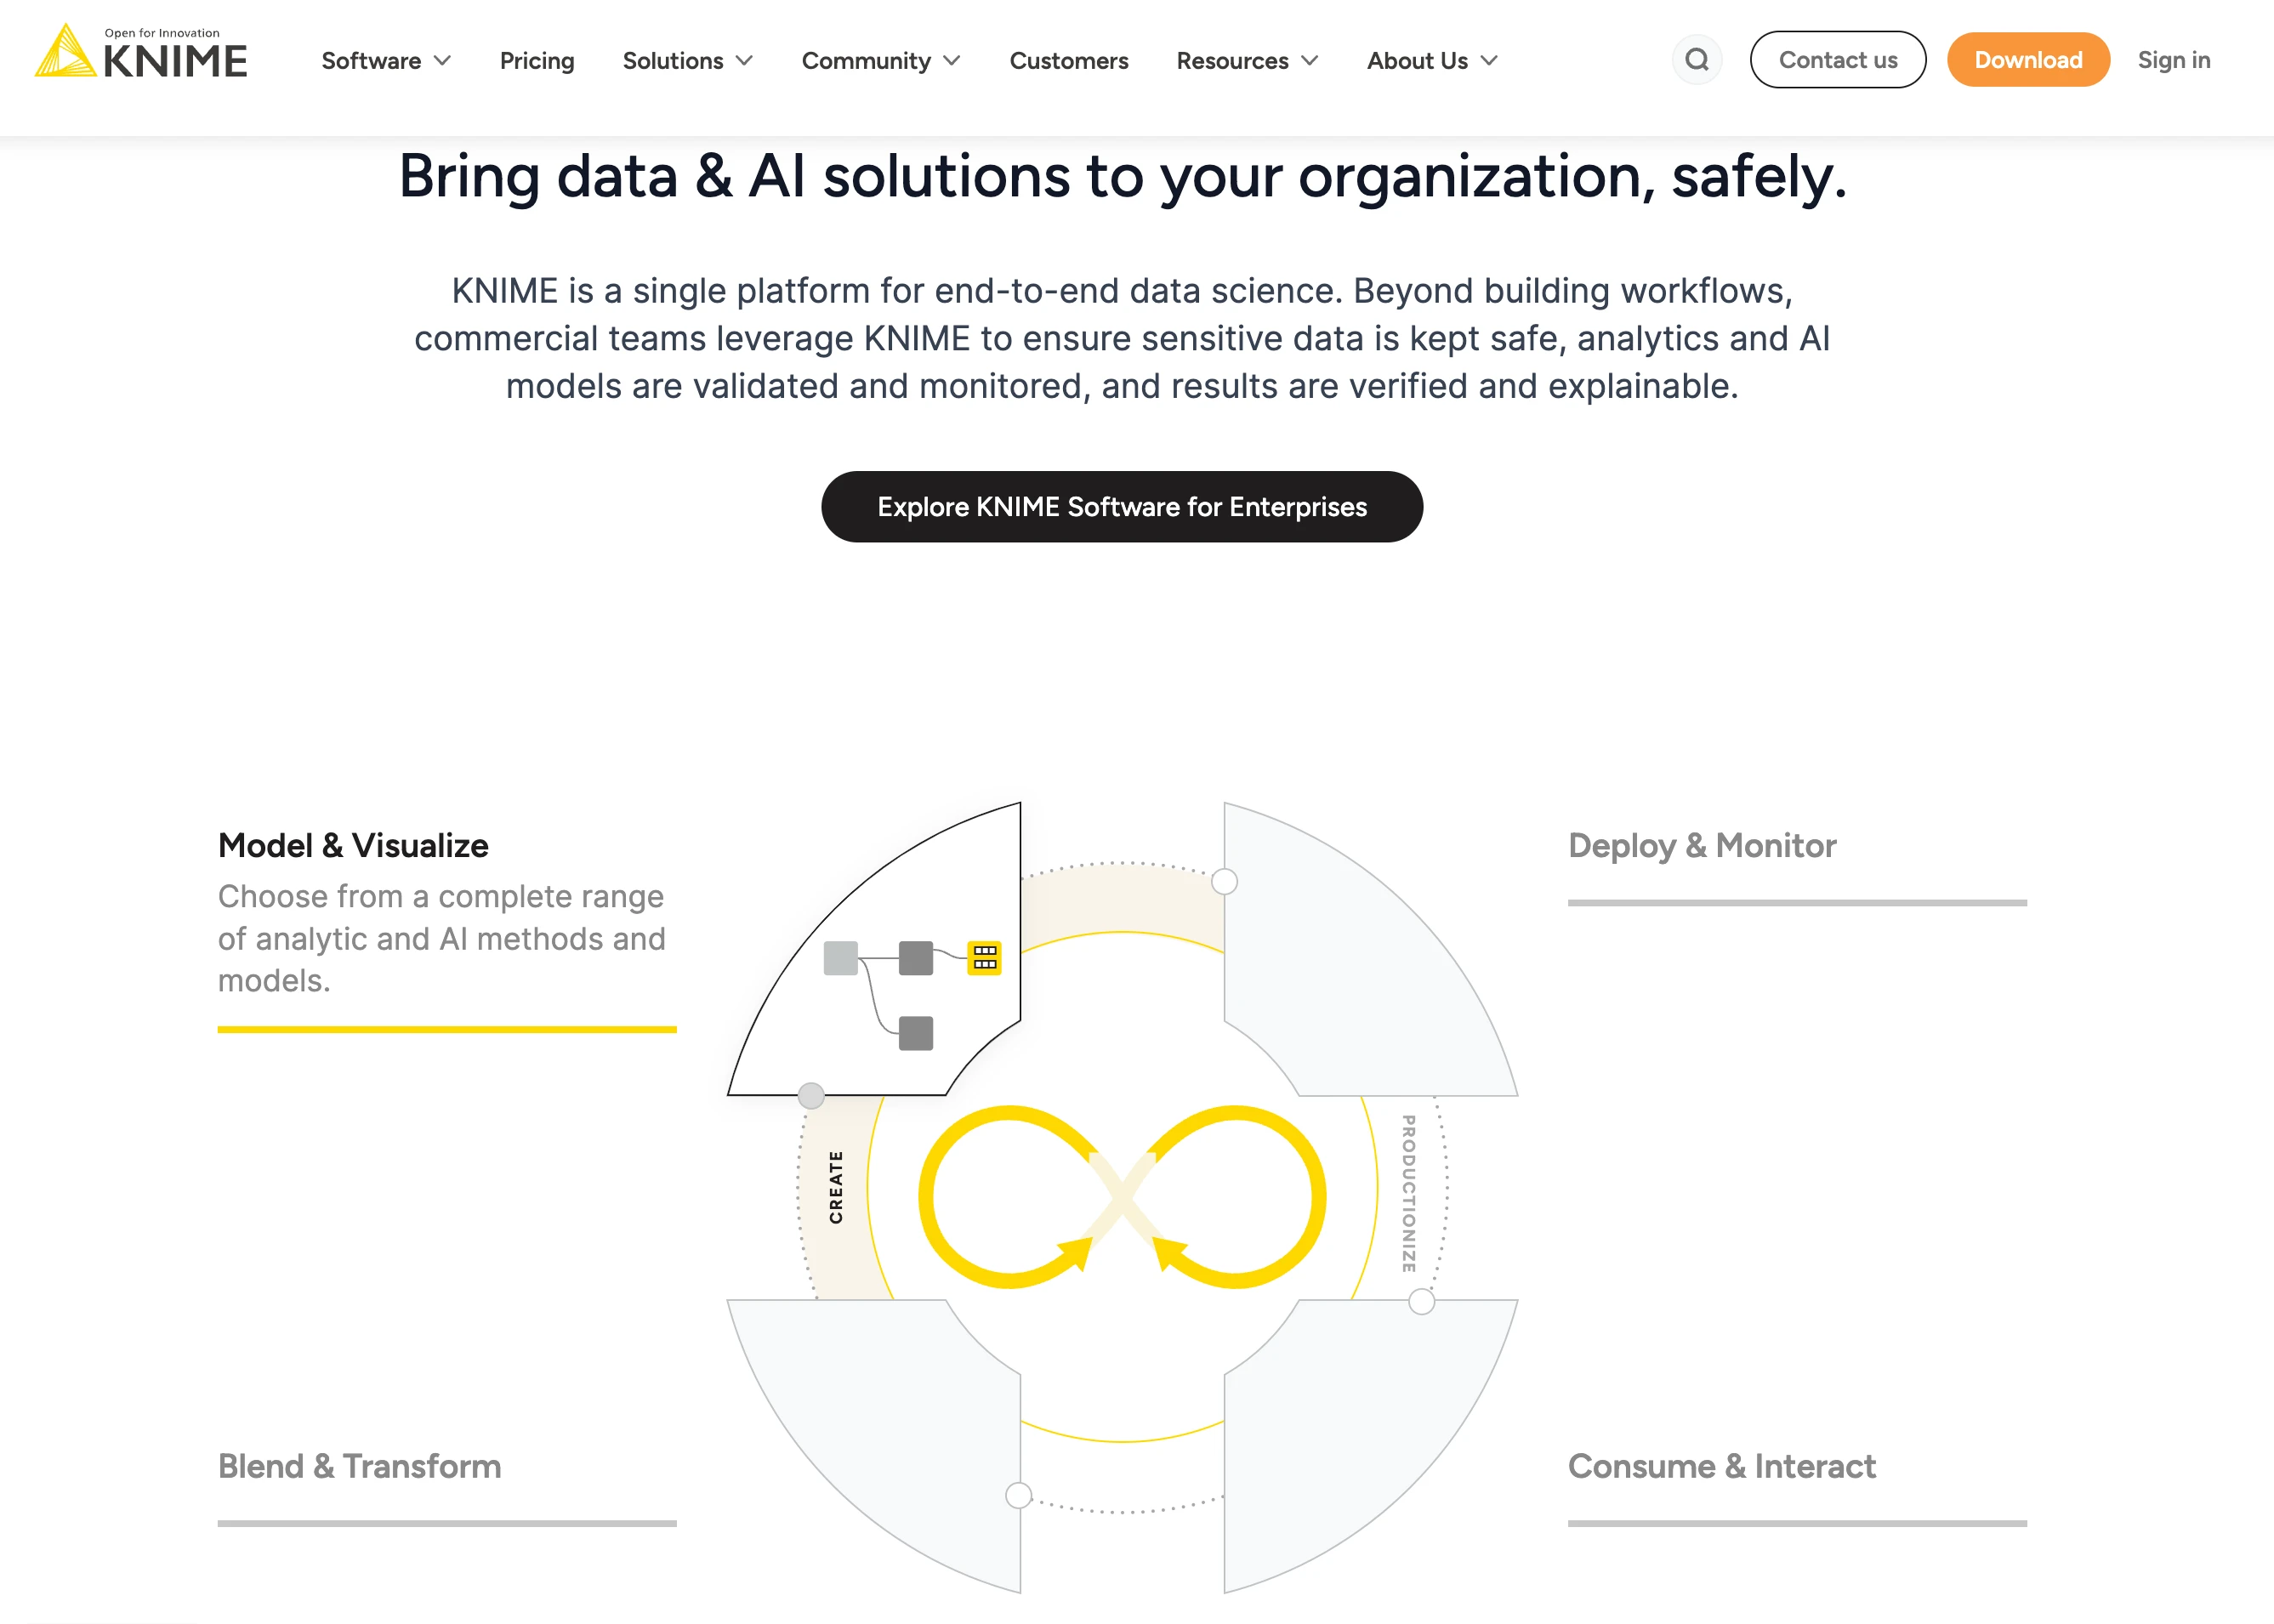
KNIME is a single platform for end-to-end data science. Beyond building workflows, commercial teams leverage KNIME to ensure sensitive data is kept safe, analytics and AI models are validated and monitored, and results are verified and explainable.
Lastly
With AI data visualization tools, you can now better understand your data and make more informed decisions in a more efficient way.
📧 Subscribe to our weekly newsletter here.


