On this page
Add a live star-history chart to your GitHub README
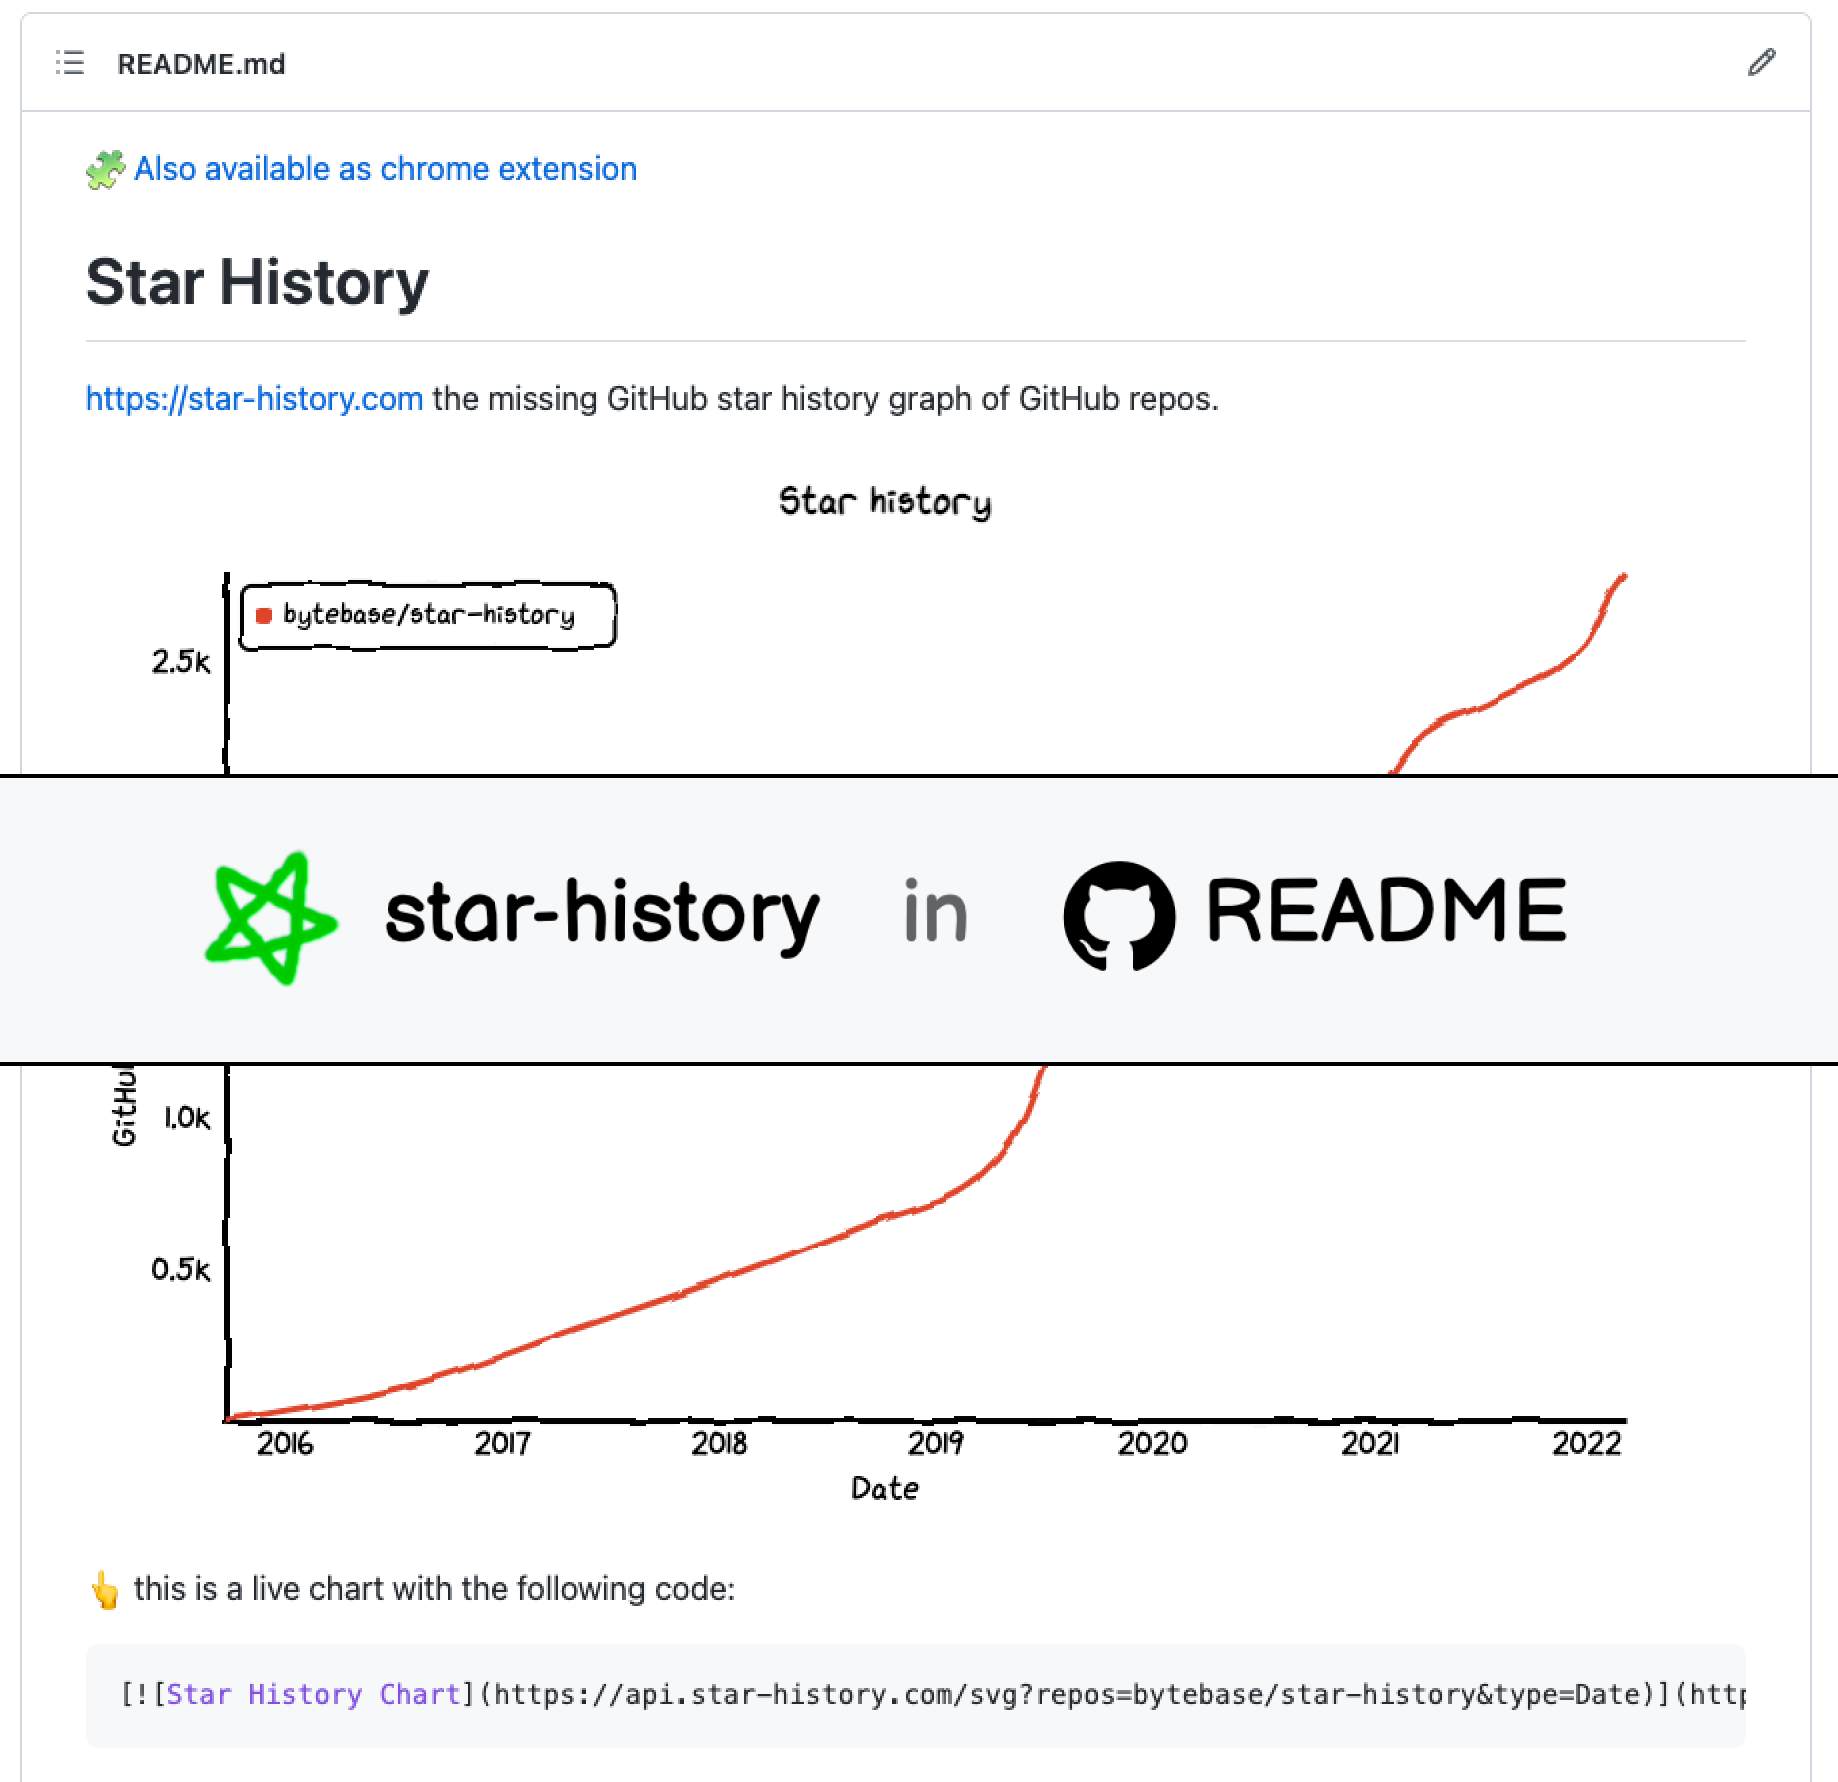
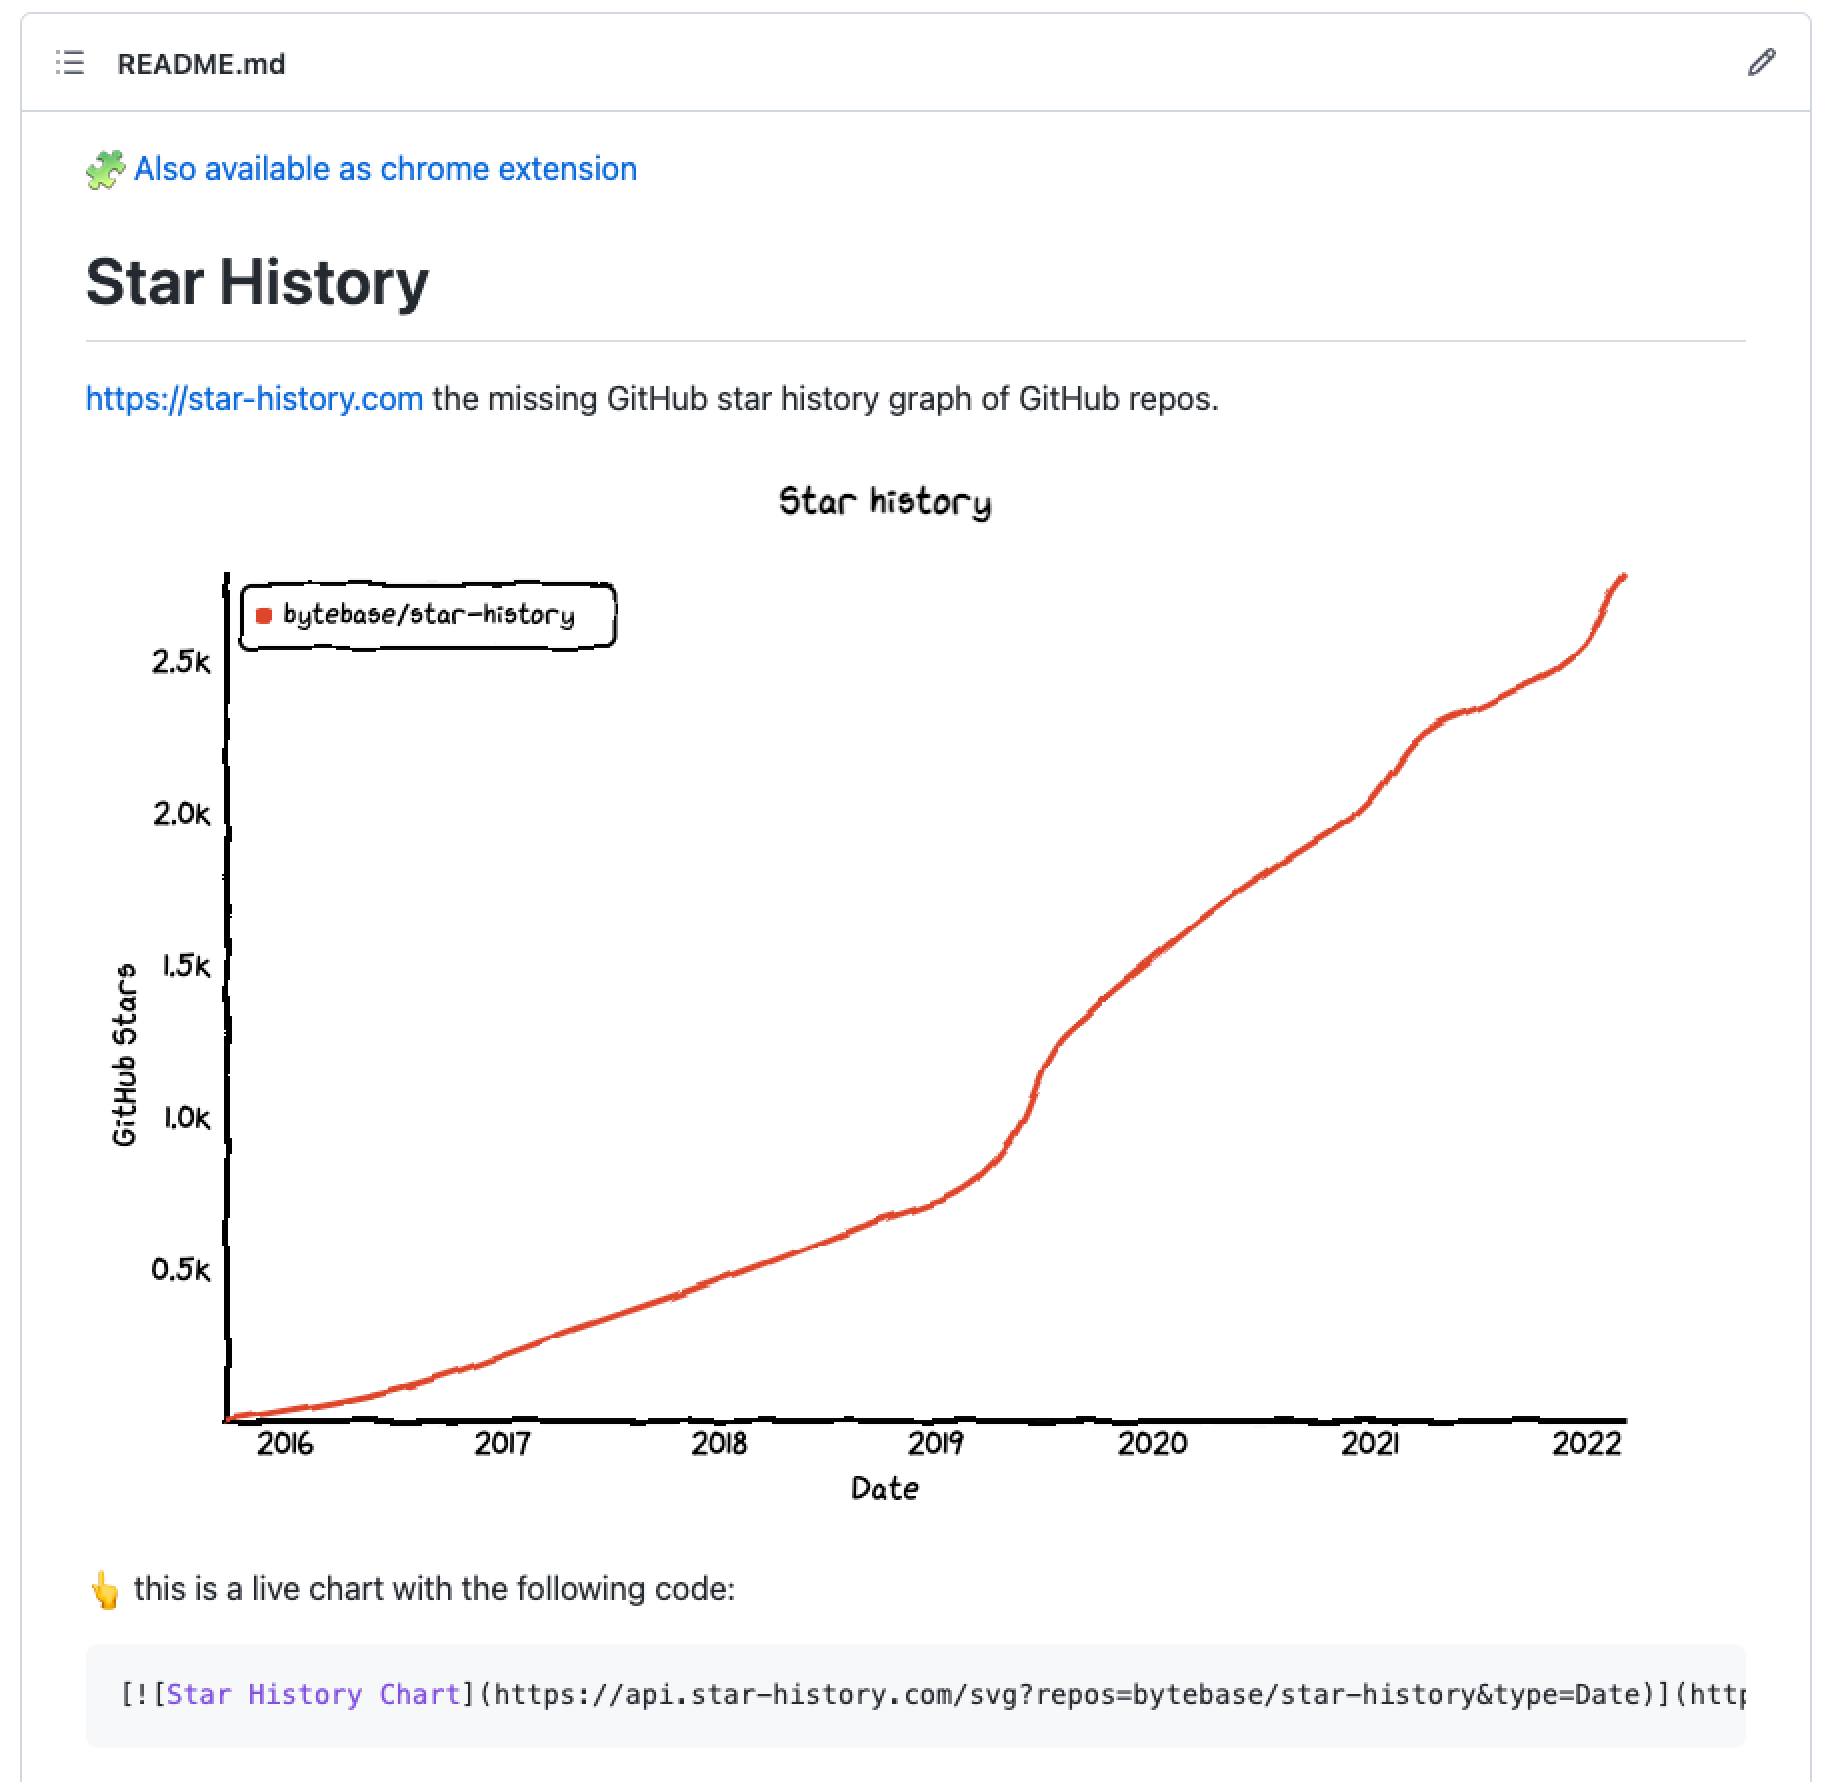 Now we support embedding a live star history chart into your GitHub README. Above is the screenshot from our own GitHub start history repo.
This feature is quite handy. A snippet would appear after querying the repository from our star-history.com main page; the only thing you need to do is simply copy that snippet into your GitHub README markdown file.
 Under the hood, it's actually a long story about developing this embedded star history chart. It all starts from an issue 6 years ago.
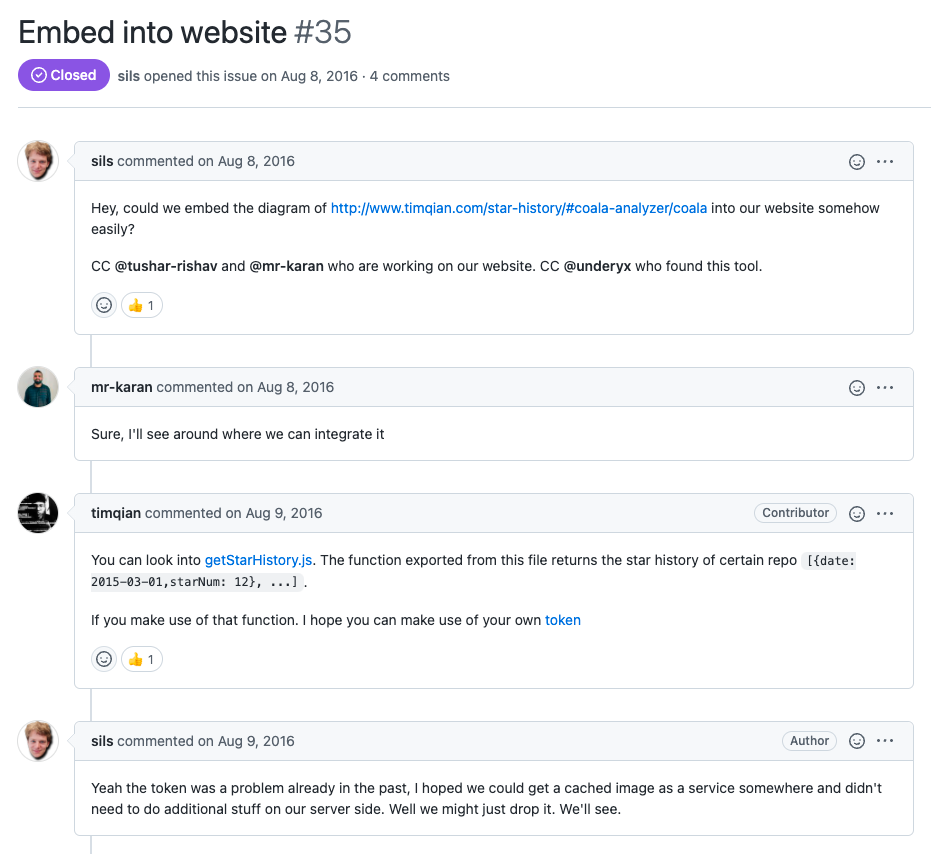
An issue from 6 years ago
In 2016, a user opened an issue asking to embed GitHub star-history chart into their own website. But due to the development resource and API token limitations, it was dismissed.
 Recently, we resumed the development effort and after completing a major refactoring of star-history, we are ready to tackle this. Our first improvement is to introduce the embeddable GitHub star-history chart using
 <iframe />.
Embed with <iframe />
After looking through the popular web-side embedding implementations, we decide to use <iframe /> as the embedded block container. It can display original charts on a webpage without implementing a backend server. And <iframe /> is also interactive with real-time data.
Because GitHub API imposes a strict rate limit on the anonymous callers, we need users to provide their self-generated tokens to overcome that limit.
Step-to-step guide to use iframe embed
Open star-history.com and query for a repository;
Click the
Embedbutton below the chart;Input your personal access token;
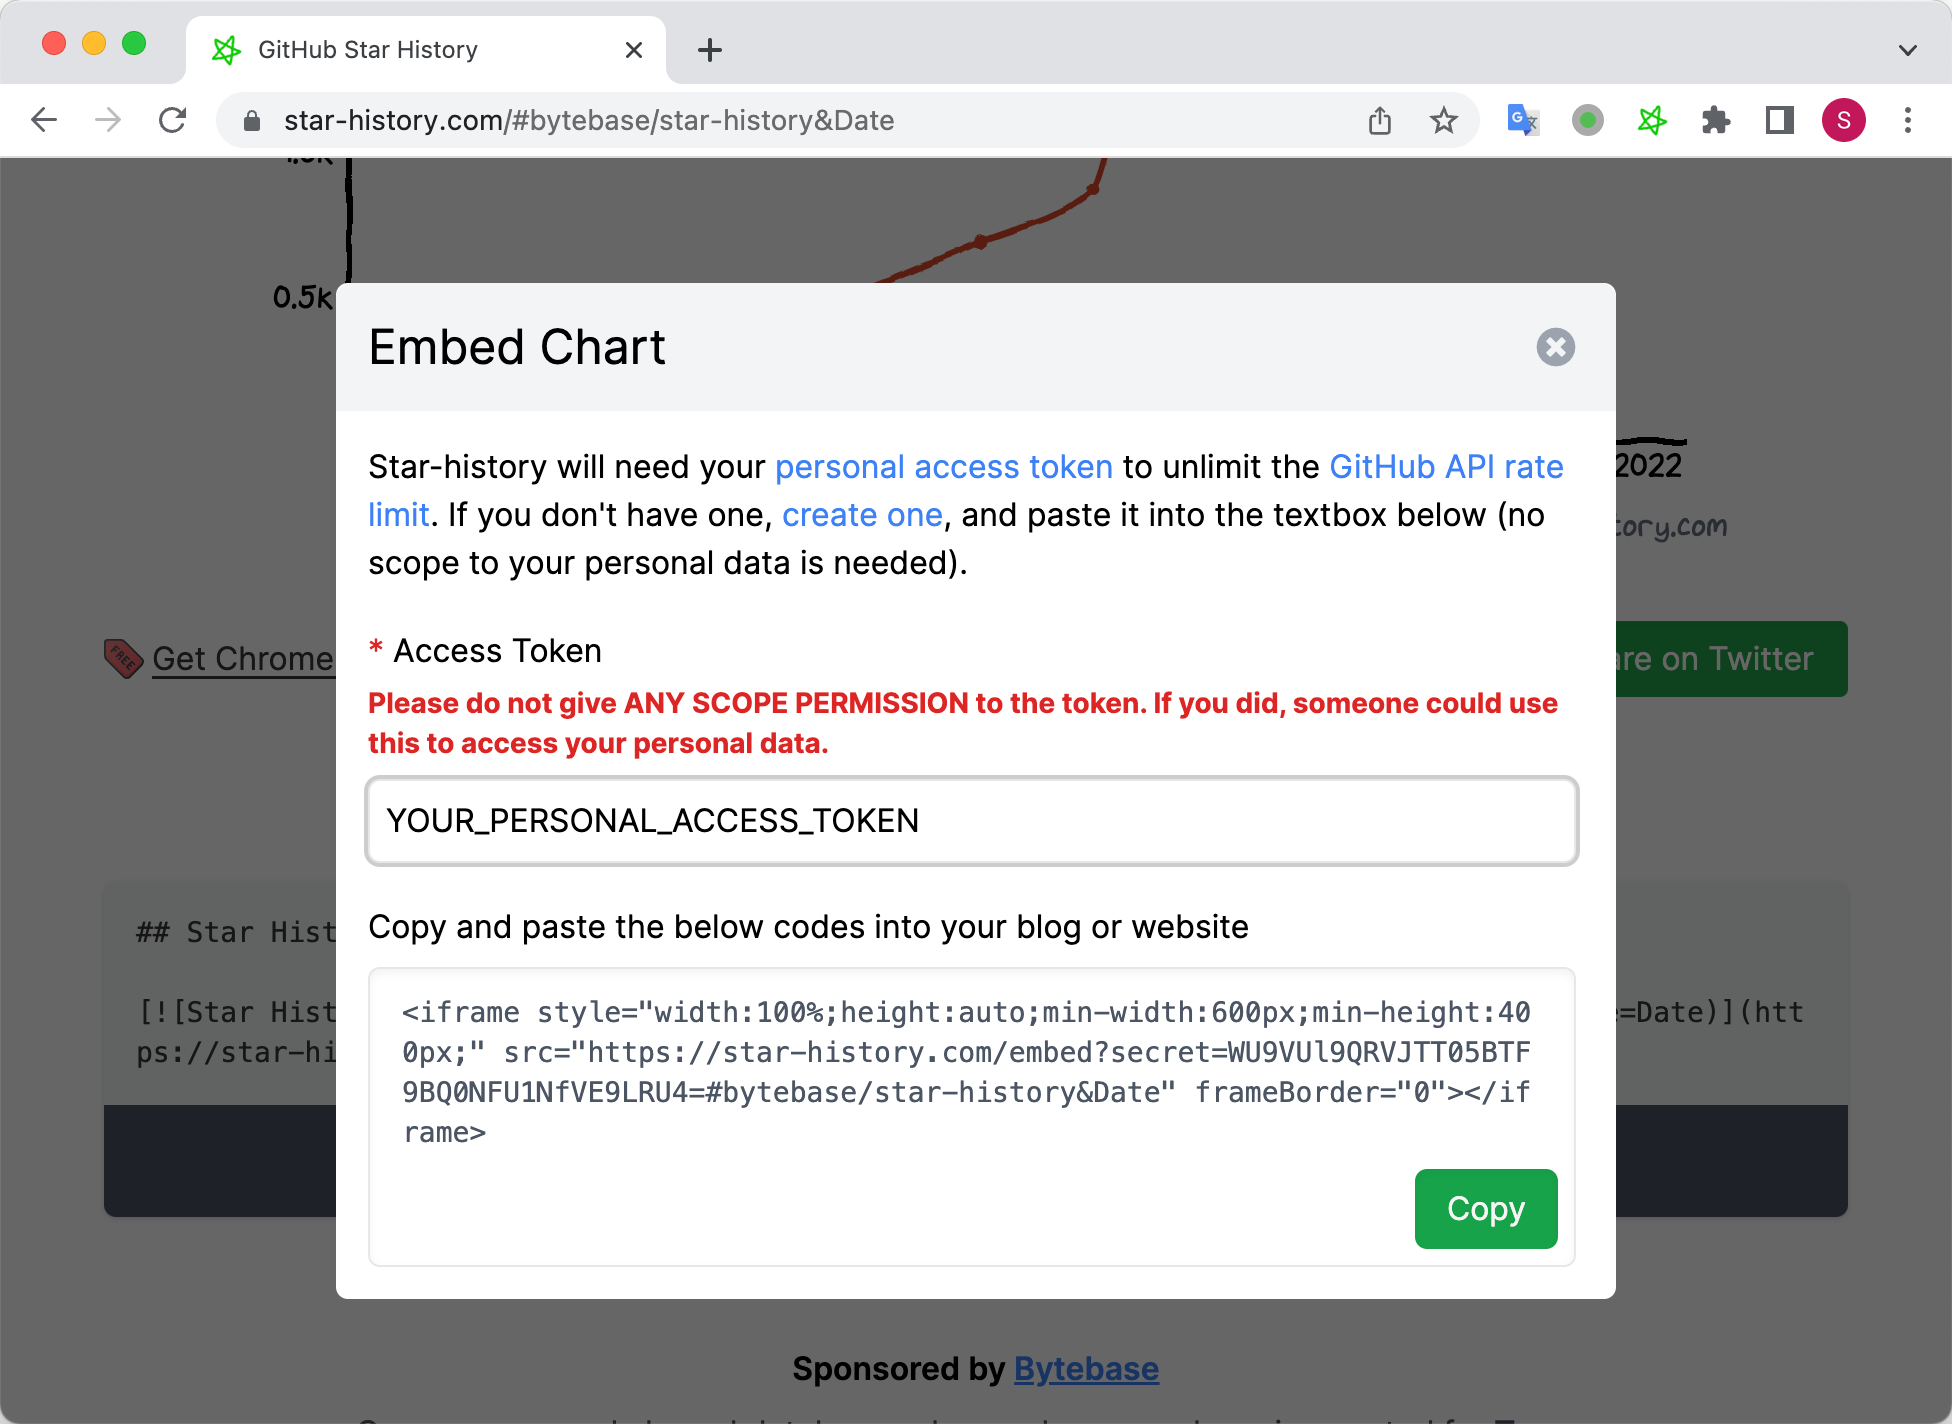
Click the
Copybutton, then paste it into your websites or blogs;
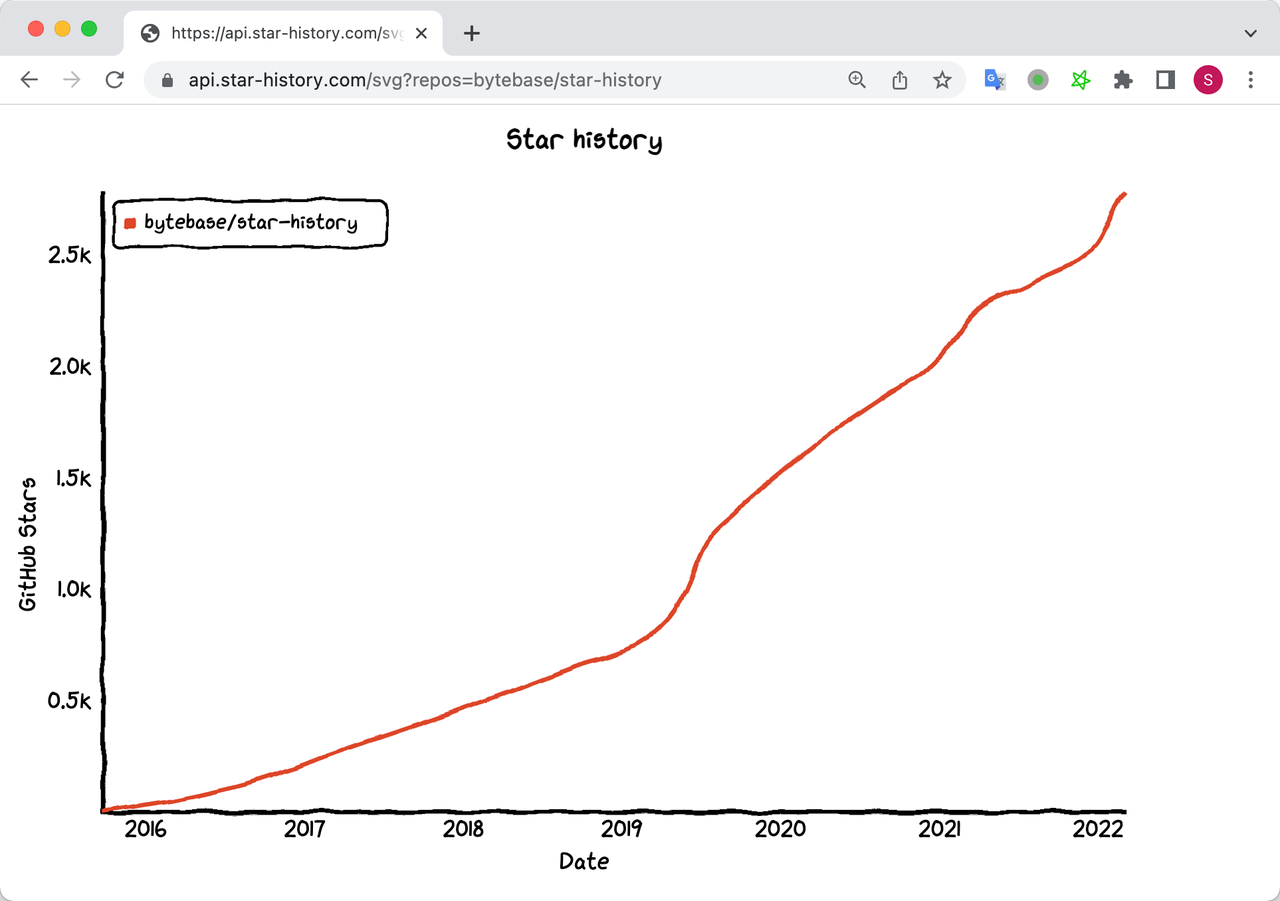
Live chart image in SVG format
The iframe-based embed block is a decent improvement, while it still has some flaws:
- One commonly used case is to embed the GitHub star-history chart into the repository README file, so that it can be displayed on the repo's front page. However, the GitHub markdown flavor disallows rendering
<iframe />, which makes it impossible to directly embed star-history charts there. - We require users to provide their personal access tokens. Though star-history never stores the token on our own server (we don't have a server at all), the token itself could be found if someone views the webpage source code. This limits the usage since it's not fully secure unless adding the chart to a trusted platform, i.e. the internal dashboard of a team.
Inspiration
We noticed that many open source projects have badges on their README
 After thorough research, we figured that those badges are dynamically generated SVG images.
Coincidentally, star-history also generates the SVG chart image. If we can return this SVG image by a link, then we can achieve a similar result as those generated badges.
Implementation
star-history has always been a single-page application (SPA) without backend code. In order to offer this feature, we have to add the backend logic to serve the image request. To reuse the SVG generation code, we choose nodejs to create a service returning the live star history chart SVG.
To avoid GitHub request rate limit, we create a token pool for polling requests. Those tokens are donated by our community members. If you would like to donate one, please follow this guide: Donate GitHub Personal Access Token for star-history.com
This is an example link to get the live SVG image for our star-history project: https://api.star-history.com/image?repos=star-history/star-history
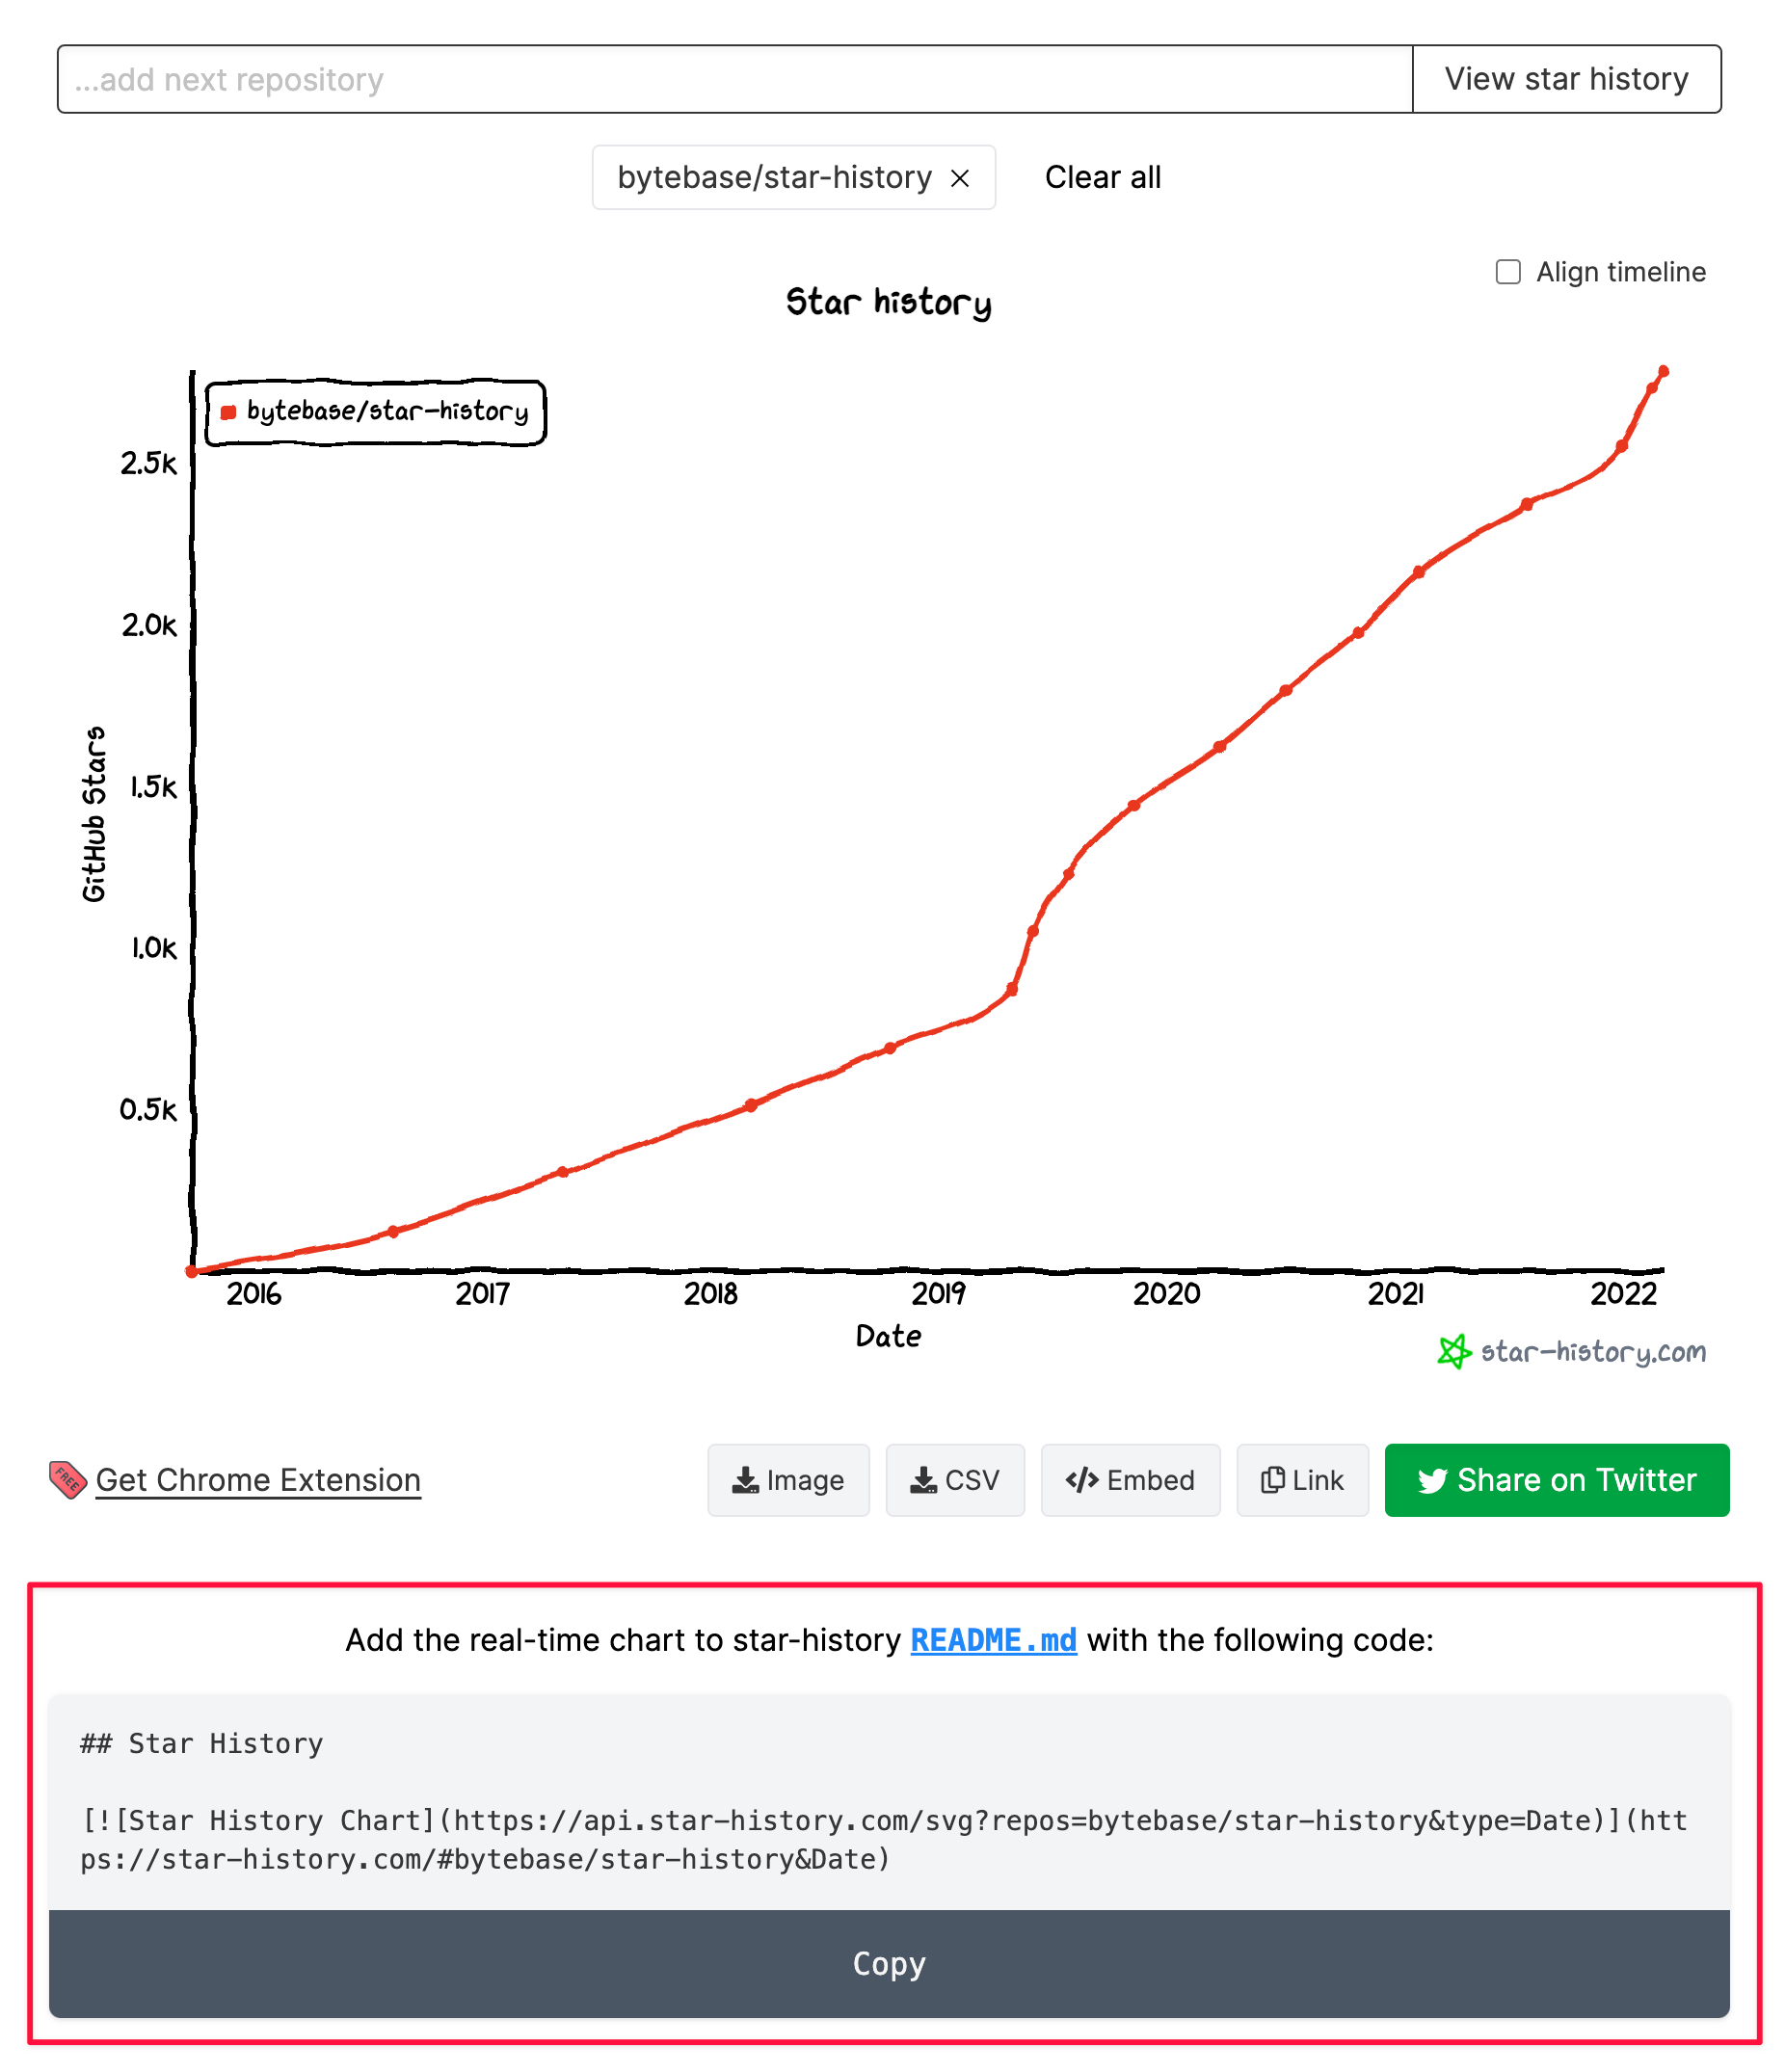
Step-to-step guide to add the chart to your GitHub README
Open star-history.com and query for a repository;
Scroll the page below the action buttons;
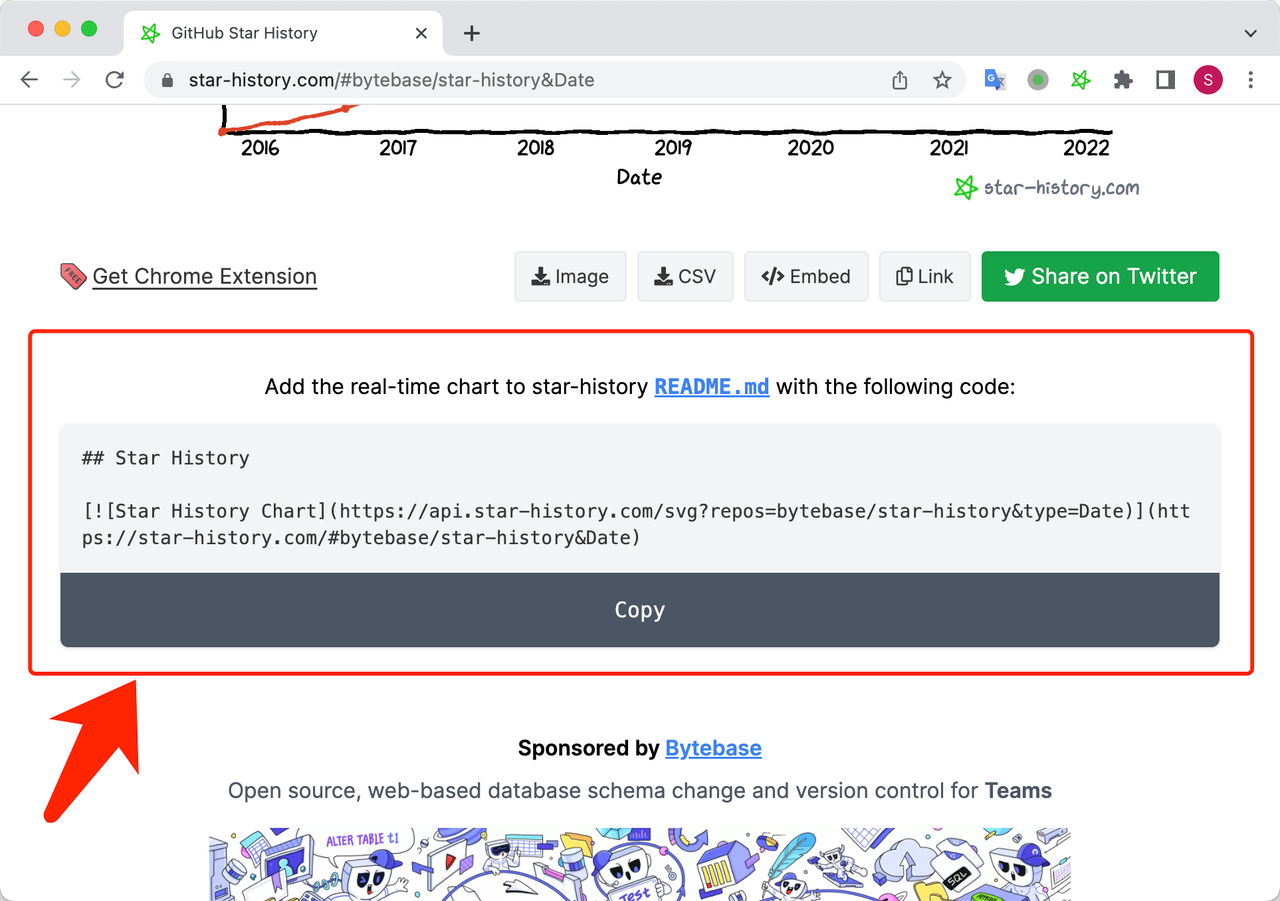
Click the
Copybutton;Paste the code into your repository's README;
Everything is done. 😎
Running on render
The existing star-history frontend is a static site and is running on render.com. As you can see, we have added the API server which is a Web Service type serving the live star history SVG image request.
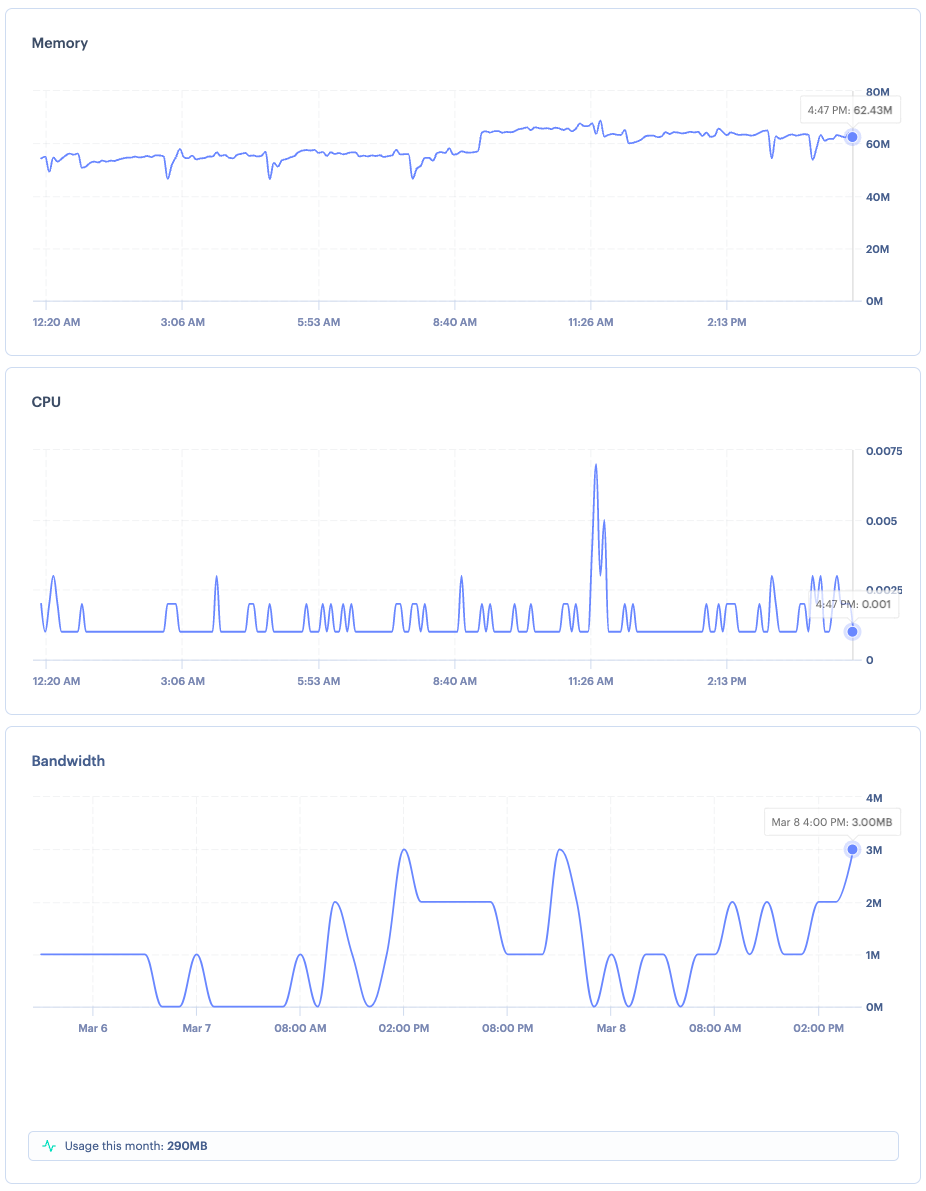
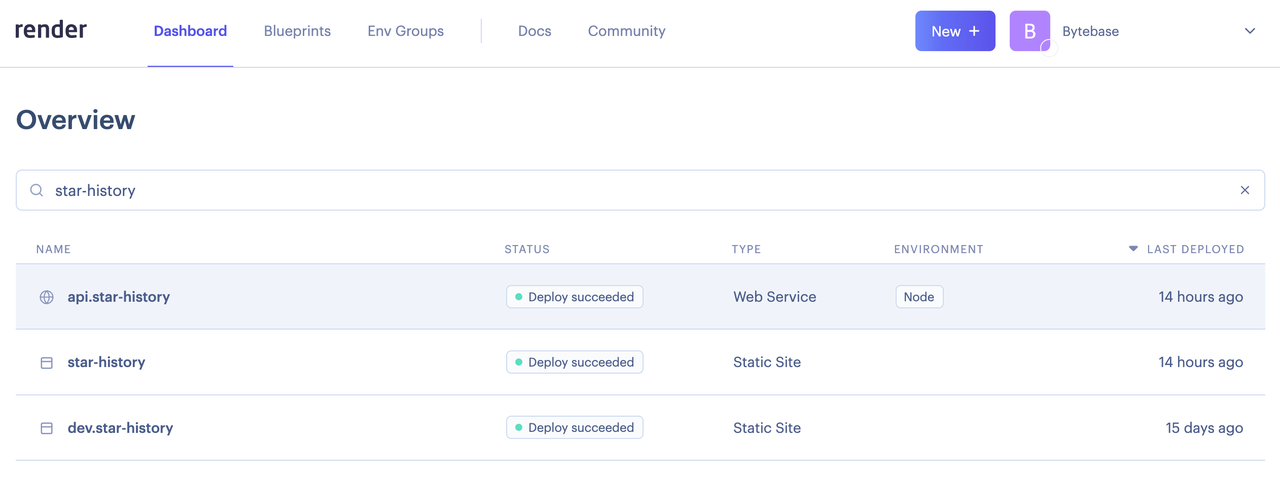 Here is the render's monitoring view and it's been running fine so far
Conclusion
We provide two ways to embed the real-time star history chart into the web pages.
- If you want to put an auto-sizeable and interactive chart on your private network, you should try the embedded chart with
<iframe />. - If you want to show a static chart with update-to-date star history data to the public, such as putting it on the GitHub repository README, you should use the image link such as
https://api.star-history.com/image?repos=star-history/star-history&type=Date
Check out examples below of using SVG embed charts in GitHub repository README and organization README.